Immigrants from Southern Europe vs Ottawa Female Poverty Among 25-34 Year Olds
COMPARE
Immigrants from Southern Europe
Ottawa
Female Poverty Among 25-34 Year Olds
Female Poverty Among 25-34 Year Olds Comparison
Immigrants from Southern Europe
Ottawa
12.8%
FEMALE POVERTY AMONG 25-34 YEAR OLDS
93.6/ 100
METRIC RATING
114th/ 347
METRIC RANK
17.1%
FEMALE POVERTY AMONG 25-34 YEAR OLDS
0.0/ 100
METRIC RATING
309th/ 347
METRIC RANK
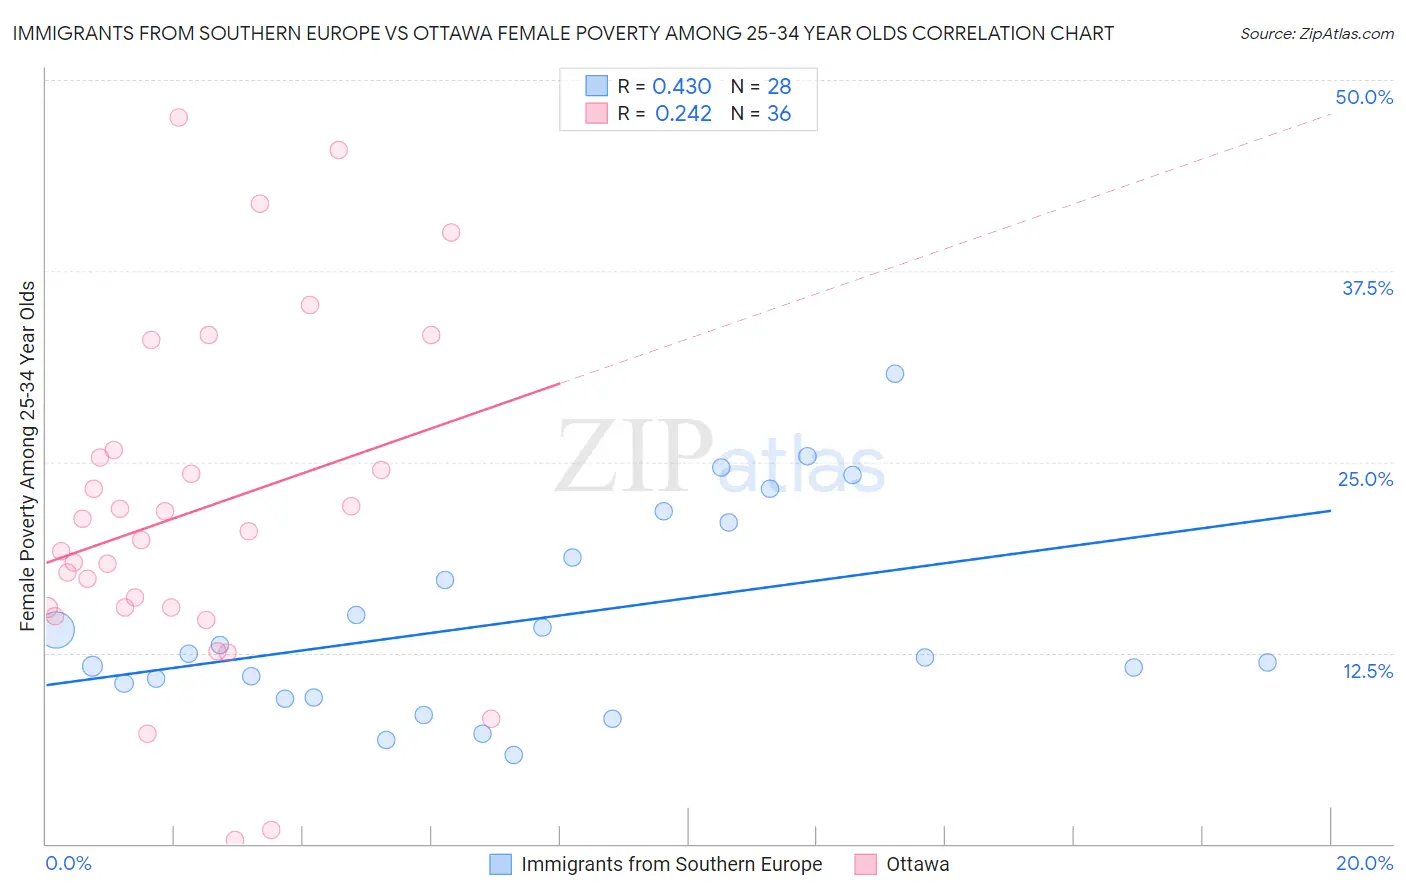
Immigrants from Southern Europe vs Ottawa Female Poverty Among 25-34 Year Olds Correlation Chart
The statistical analysis conducted on geographies consisting of 394,458,133 people shows a moderate positive correlation between the proportion of Immigrants from Southern Europe and poverty level among females between the ages 25 and 34 in the United States with a correlation coefficient (R) of 0.430 and weighted average of 12.8%. Similarly, the statistical analysis conducted on geographies consisting of 49,772,862 people shows a weak positive correlation between the proportion of Ottawa and poverty level among females between the ages 25 and 34 in the United States with a correlation coefficient (R) of 0.242 and weighted average of 17.1%, a difference of 33.8%.
Female Poverty Among 25-34 Year Olds Correlation Summary
| Measurement | Immigrants from Southern Europe | Ottawa |
| Minimum | 5.8% | 0.24% |
| Maximum | 30.8% | 47.6% |
| Range | 25.0% | 47.3% |
| Mean | 14.7% | 21.8% |
| Median | 12.3% | 20.2% |
| Interquartile 25% (IQ1) | 10.0% | 15.5% |
| Interquartile 75% (IQ3) | 19.9% | 25.5% |
| Interquartile Range (IQR) | 9.9% | 10.1% |
| Standard Deviation (Sample) | 6.6% | 11.2% |
| Standard Deviation (Population) | 6.5% | 11.0% |
Similar Demographics by Female Poverty Among 25-34 Year Olds
Demographics Similar to Immigrants from Southern Europe by Female Poverty Among 25-34 Year Olds
In terms of female poverty among 25-34 year olds, the demographic groups most similar to Immigrants from Southern Europe are Immigrants from Syria (12.8%, a difference of 0.070%), Immigrants from Brazil (12.8%, a difference of 0.090%), Immigrants from Morocco (12.8%, a difference of 0.11%), Danish (12.8%, a difference of 0.13%), and Chilean (12.8%, a difference of 0.13%).
| Demographics | Rating | Rank | Female Poverty Among 25-34 Year Olds |
| Poles | 94.9 /100 | #107 | Exceptional 12.7% |
| Immigrants | Norway | 94.4 /100 | #108 | Exceptional 12.7% |
| Immigrants | Peru | 94.3 /100 | #109 | Exceptional 12.7% |
| Australians | 94.1 /100 | #110 | Exceptional 12.8% |
| Danes | 93.9 /100 | #111 | Exceptional 12.8% |
| Immigrants | Morocco | 93.9 /100 | #112 | Exceptional 12.8% |
| Immigrants | Syria | 93.8 /100 | #113 | Exceptional 12.8% |
| Immigrants | Southern Europe | 93.6 /100 | #114 | Exceptional 12.8% |
| Immigrants | Brazil | 93.3 /100 | #115 | Exceptional 12.8% |
| Chileans | 93.2 /100 | #116 | Exceptional 12.8% |
| Immigrants | Kuwait | 93.1 /100 | #117 | Exceptional 12.8% |
| Mongolians | 93.0 /100 | #118 | Exceptional 12.8% |
| Immigrants | Nepal | 93.0 /100 | #119 | Exceptional 12.8% |
| Carpatho Rusyns | 93.0 /100 | #120 | Exceptional 12.8% |
| Romanians | 92.8 /100 | #121 | Exceptional 12.8% |
Demographics Similar to Ottawa by Female Poverty Among 25-34 Year Olds
In terms of female poverty among 25-34 year olds, the demographic groups most similar to Ottawa are African (17.0%, a difference of 0.30%), Cherokee (17.2%, a difference of 0.47%), Yaqui (17.0%, a difference of 0.50%), Chickasaw (17.0%, a difference of 0.52%), and Immigrants from Honduras (17.3%, a difference of 0.95%).
| Demographics | Rating | Rank | Female Poverty Among 25-34 Year Olds |
| Alaska Natives | 0.0 /100 | #302 | Tragic 16.8% |
| Immigrants | Mexico | 0.0 /100 | #303 | Tragic 16.8% |
| Hondurans | 0.0 /100 | #304 | Tragic 16.9% |
| Immigrants | Cabo Verde | 0.0 /100 | #305 | Tragic 16.9% |
| Chickasaw | 0.0 /100 | #306 | Tragic 17.0% |
| Yaqui | 0.0 /100 | #307 | Tragic 17.0% |
| Africans | 0.0 /100 | #308 | Tragic 17.0% |
| Ottawa | 0.0 /100 | #309 | Tragic 17.1% |
| Cherokee | 0.0 /100 | #310 | Tragic 17.2% |
| Immigrants | Honduras | 0.0 /100 | #311 | Tragic 17.3% |
| Iroquois | 0.0 /100 | #312 | Tragic 17.5% |
| Colville | 0.0 /100 | #313 | Tragic 17.5% |
| Immigrants | Dominican Republic | 0.0 /100 | #314 | Tragic 17.6% |
| Yakama | 0.0 /100 | #315 | Tragic 17.6% |
| Dominicans | 0.0 /100 | #316 | Tragic 17.6% |