Immigrants from Czechoslovakia vs Ottawa Female Poverty Among 25-34 Year Olds
COMPARE
Immigrants from Czechoslovakia
Ottawa
Female Poverty Among 25-34 Year Olds
Female Poverty Among 25-34 Year Olds Comparison
Immigrants from Czechoslovakia
Ottawa
12.1%
FEMALE POVERTY AMONG 25-34 YEAR OLDS
99.4/ 100
METRIC RATING
61st/ 347
METRIC RANK
17.1%
FEMALE POVERTY AMONG 25-34 YEAR OLDS
0.0/ 100
METRIC RATING
309th/ 347
METRIC RANK
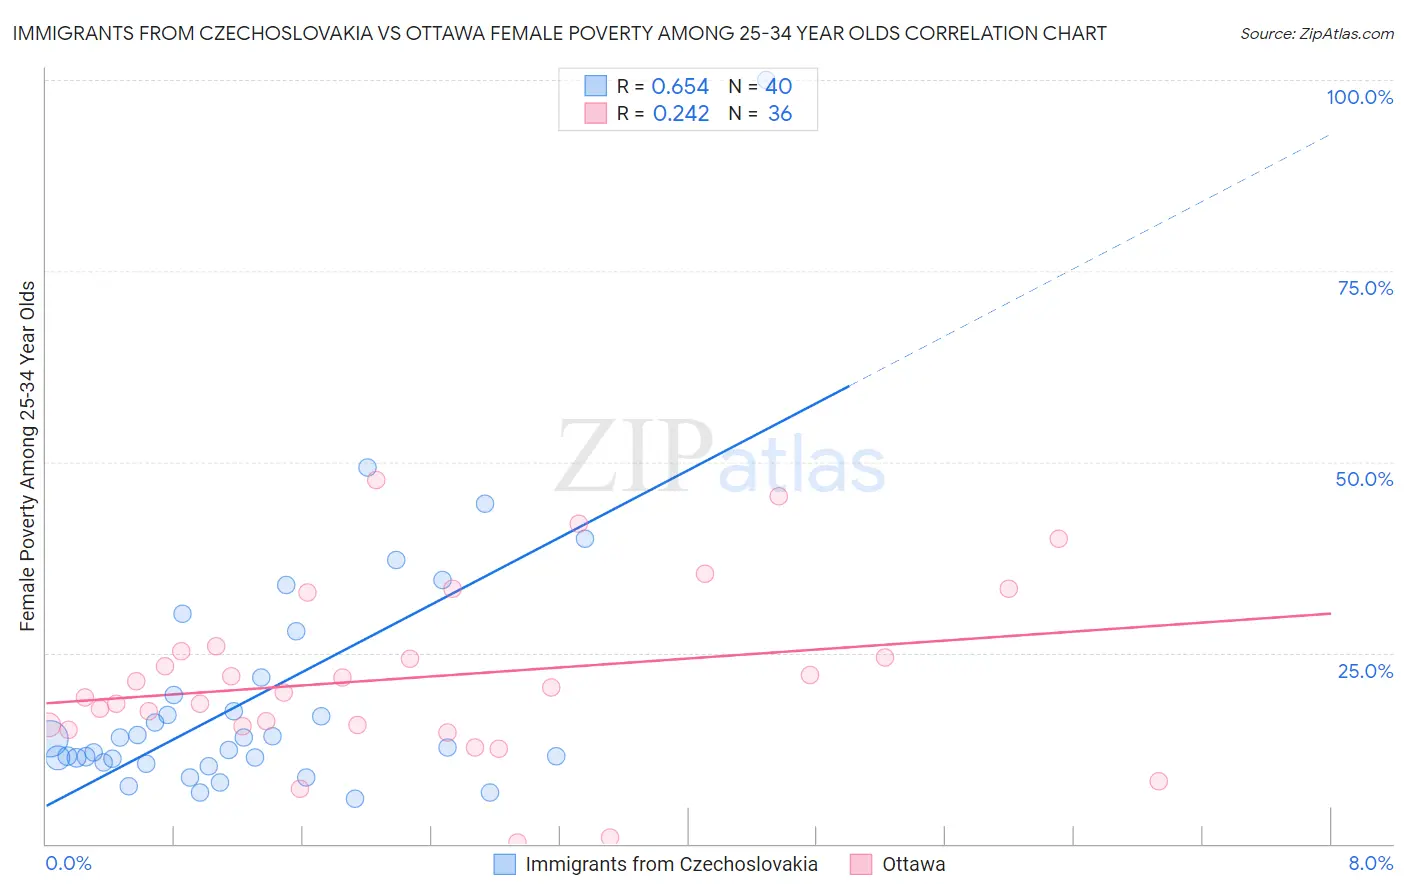
Immigrants from Czechoslovakia vs Ottawa Female Poverty Among 25-34 Year Olds Correlation Chart
The statistical analysis conducted on geographies consisting of 193,241,003 people shows a significant positive correlation between the proportion of Immigrants from Czechoslovakia and poverty level among females between the ages 25 and 34 in the United States with a correlation coefficient (R) of 0.654 and weighted average of 12.1%. Similarly, the statistical analysis conducted on geographies consisting of 49,772,862 people shows a weak positive correlation between the proportion of Ottawa and poverty level among females between the ages 25 and 34 in the United States with a correlation coefficient (R) of 0.242 and weighted average of 17.1%, a difference of 41.2%.
Female Poverty Among 25-34 Year Olds Correlation Summary
| Measurement | Immigrants from Czechoslovakia | Ottawa |
| Minimum | 5.8% | 0.24% |
| Maximum | 100.0% | 47.6% |
| Range | 94.2% | 47.3% |
| Mean | 19.4% | 21.8% |
| Median | 13.2% | 20.2% |
| Interquartile 25% (IQ1) | 10.9% | 15.5% |
| Interquartile 75% (IQ3) | 20.6% | 25.5% |
| Interquartile Range (IQR) | 9.7% | 10.1% |
| Standard Deviation (Sample) | 17.1% | 11.2% |
| Standard Deviation (Population) | 16.9% | 11.0% |
Similar Demographics by Female Poverty Among 25-34 Year Olds
Demographics Similar to Immigrants from Czechoslovakia by Female Poverty Among 25-34 Year Olds
In terms of female poverty among 25-34 year olds, the demographic groups most similar to Immigrants from Czechoslovakia are Immigrants from Northern Europe (12.1%, a difference of 0.020%), Immigrants from Romania (12.1%, a difference of 0.11%), Russian (12.1%, a difference of 0.11%), Immigrants from Moldova (12.1%, a difference of 0.17%), and Soviet Union (12.1%, a difference of 0.18%).
| Demographics | Rating | Rank | Female Poverty Among 25-34 Year Olds |
| Eastern Europeans | 99.6 /100 | #54 | Exceptional 12.0% |
| Immigrants | Philippines | 99.5 /100 | #55 | Exceptional 12.0% |
| Luxembourgers | 99.5 /100 | #56 | Exceptional 12.1% |
| Jordanians | 99.4 /100 | #57 | Exceptional 12.1% |
| Immigrants | Romania | 99.4 /100 | #58 | Exceptional 12.1% |
| Russians | 99.4 /100 | #59 | Exceptional 12.1% |
| Immigrants | Northern Europe | 99.4 /100 | #60 | Exceptional 12.1% |
| Immigrants | Czechoslovakia | 99.4 /100 | #61 | Exceptional 12.1% |
| Immigrants | Moldova | 99.3 /100 | #62 | Exceptional 12.1% |
| Soviet Union | 99.3 /100 | #63 | Exceptional 12.1% |
| Immigrants | Russia | 99.2 /100 | #64 | Exceptional 12.2% |
| Armenians | 99.2 /100 | #65 | Exceptional 12.2% |
| Immigrants | Europe | 99.2 /100 | #66 | Exceptional 12.2% |
| Laotians | 99.2 /100 | #67 | Exceptional 12.2% |
| Sri Lankans | 99.1 /100 | #68 | Exceptional 12.2% |
Demographics Similar to Ottawa by Female Poverty Among 25-34 Year Olds
In terms of female poverty among 25-34 year olds, the demographic groups most similar to Ottawa are African (17.0%, a difference of 0.30%), Cherokee (17.2%, a difference of 0.47%), Yaqui (17.0%, a difference of 0.50%), Chickasaw (17.0%, a difference of 0.52%), and Immigrants from Honduras (17.3%, a difference of 0.95%).
| Demographics | Rating | Rank | Female Poverty Among 25-34 Year Olds |
| Alaska Natives | 0.0 /100 | #302 | Tragic 16.8% |
| Immigrants | Mexico | 0.0 /100 | #303 | Tragic 16.8% |
| Hondurans | 0.0 /100 | #304 | Tragic 16.9% |
| Immigrants | Cabo Verde | 0.0 /100 | #305 | Tragic 16.9% |
| Chickasaw | 0.0 /100 | #306 | Tragic 17.0% |
| Yaqui | 0.0 /100 | #307 | Tragic 17.0% |
| Africans | 0.0 /100 | #308 | Tragic 17.0% |
| Ottawa | 0.0 /100 | #309 | Tragic 17.1% |
| Cherokee | 0.0 /100 | #310 | Tragic 17.2% |
| Immigrants | Honduras | 0.0 /100 | #311 | Tragic 17.3% |
| Iroquois | 0.0 /100 | #312 | Tragic 17.5% |
| Colville | 0.0 /100 | #313 | Tragic 17.5% |
| Immigrants | Dominican Republic | 0.0 /100 | #314 | Tragic 17.6% |
| Yakama | 0.0 /100 | #315 | Tragic 17.6% |
| Dominicans | 0.0 /100 | #316 | Tragic 17.6% |