Houma vs Ottawa Female Poverty Among 25-34 Year Olds
COMPARE
Houma
Ottawa
Female Poverty Among 25-34 Year Olds
Female Poverty Among 25-34 Year Olds Comparison
Houma
Ottawa
22.7%
FEMALE POVERTY AMONG 25-34 YEAR OLDS
0.0/ 100
METRIC RATING
338th/ 347
METRIC RANK
17.1%
FEMALE POVERTY AMONG 25-34 YEAR OLDS
0.0/ 100
METRIC RATING
309th/ 347
METRIC RANK
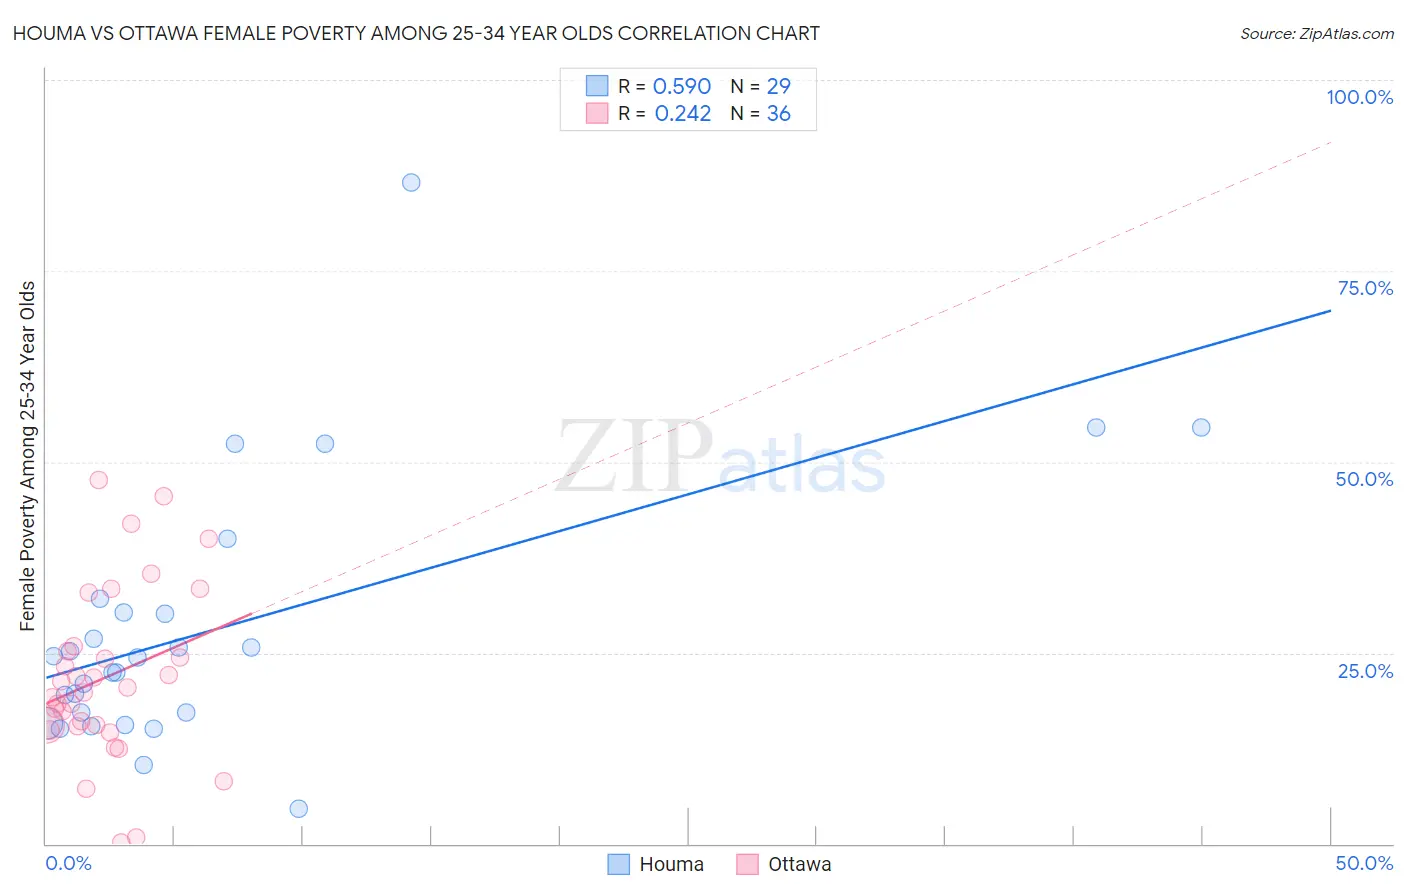
Houma vs Ottawa Female Poverty Among 25-34 Year Olds Correlation Chart
The statistical analysis conducted on geographies consisting of 36,714,026 people shows a substantial positive correlation between the proportion of Houma and poverty level among females between the ages 25 and 34 in the United States with a correlation coefficient (R) of 0.590 and weighted average of 22.7%. Similarly, the statistical analysis conducted on geographies consisting of 49,772,862 people shows a weak positive correlation between the proportion of Ottawa and poverty level among females between the ages 25 and 34 in the United States with a correlation coefficient (R) of 0.242 and weighted average of 17.1%, a difference of 32.9%.
Female Poverty Among 25-34 Year Olds Correlation Summary
| Measurement | Houma | Ottawa |
| Minimum | 4.5% | 0.24% |
| Maximum | 86.6% | 47.6% |
| Range | 82.1% | 47.3% |
| Mean | 28.1% | 21.8% |
| Median | 24.3% | 20.2% |
| Interquartile 25% (IQ1) | 16.5% | 15.5% |
| Interquartile 75% (IQ3) | 31.2% | 25.5% |
| Interquartile Range (IQR) | 14.7% | 10.1% |
| Standard Deviation (Sample) | 17.3% | 11.2% |
| Standard Deviation (Population) | 17.0% | 11.0% |
Similar Demographics by Female Poverty Among 25-34 Year Olds
Demographics Similar to Houma by Female Poverty Among 25-34 Year Olds
In terms of female poverty among 25-34 year olds, the demographic groups most similar to Houma are Crow (22.7%, a difference of 0.17%), Yuman (22.9%, a difference of 0.85%), Sioux (23.0%, a difference of 1.0%), Pueblo (22.2%, a difference of 2.5%), and Navajo (23.3%, a difference of 2.7%).
| Demographics | Rating | Rank | Female Poverty Among 25-34 Year Olds |
| Kiowa | 0.0 /100 | #331 | Tragic 19.7% |
| Immigrants | Yemen | 0.0 /100 | #332 | Tragic 19.8% |
| Cajuns | 0.0 /100 | #333 | Tragic 19.9% |
| Apache | 0.0 /100 | #334 | Tragic 20.1% |
| Natives/Alaskans | 0.0 /100 | #335 | Tragic 20.3% |
| Pueblo | 0.0 /100 | #336 | Tragic 22.2% |
| Crow | 0.0 /100 | #337 | Tragic 22.7% |
| Houma | 0.0 /100 | #338 | Tragic 22.7% |
| Yuman | 0.0 /100 | #339 | Tragic 22.9% |
| Sioux | 0.0 /100 | #340 | Tragic 23.0% |
| Navajo | 0.0 /100 | #341 | Tragic 23.3% |
| Hopi | 0.0 /100 | #342 | Tragic 23.7% |
| Yup'ik | 0.0 /100 | #343 | Tragic 24.3% |
| Tohono O'odham | 0.0 /100 | #344 | Tragic 24.7% |
| Pima | 0.0 /100 | #345 | Tragic 25.3% |
Demographics Similar to Ottawa by Female Poverty Among 25-34 Year Olds
In terms of female poverty among 25-34 year olds, the demographic groups most similar to Ottawa are African (17.0%, a difference of 0.30%), Cherokee (17.2%, a difference of 0.47%), Yaqui (17.0%, a difference of 0.50%), Chickasaw (17.0%, a difference of 0.52%), and Immigrants from Honduras (17.3%, a difference of 0.95%).
| Demographics | Rating | Rank | Female Poverty Among 25-34 Year Olds |
| Alaska Natives | 0.0 /100 | #302 | Tragic 16.8% |
| Immigrants | Mexico | 0.0 /100 | #303 | Tragic 16.8% |
| Hondurans | 0.0 /100 | #304 | Tragic 16.9% |
| Immigrants | Cabo Verde | 0.0 /100 | #305 | Tragic 16.9% |
| Chickasaw | 0.0 /100 | #306 | Tragic 17.0% |
| Yaqui | 0.0 /100 | #307 | Tragic 17.0% |
| Africans | 0.0 /100 | #308 | Tragic 17.0% |
| Ottawa | 0.0 /100 | #309 | Tragic 17.1% |
| Cherokee | 0.0 /100 | #310 | Tragic 17.2% |
| Immigrants | Honduras | 0.0 /100 | #311 | Tragic 17.3% |
| Iroquois | 0.0 /100 | #312 | Tragic 17.5% |
| Colville | 0.0 /100 | #313 | Tragic 17.5% |
| Immigrants | Dominican Republic | 0.0 /100 | #314 | Tragic 17.6% |
| Yakama | 0.0 /100 | #315 | Tragic 17.6% |
| Dominicans | 0.0 /100 | #316 | Tragic 17.6% |