Immigrants from Southern Europe vs Bolivian Female Poverty Among 25-34 Year Olds
COMPARE
Immigrants from Southern Europe
Bolivian
Female Poverty Among 25-34 Year Olds
Female Poverty Among 25-34 Year Olds Comparison
Immigrants from Southern Europe
Bolivians
12.8%
FEMALE POVERTY AMONG 25-34 YEAR OLDS
93.6/ 100
METRIC RATING
114th/ 347
METRIC RANK
11.4%
FEMALE POVERTY AMONG 25-34 YEAR OLDS
99.9/ 100
METRIC RATING
23rd/ 347
METRIC RANK
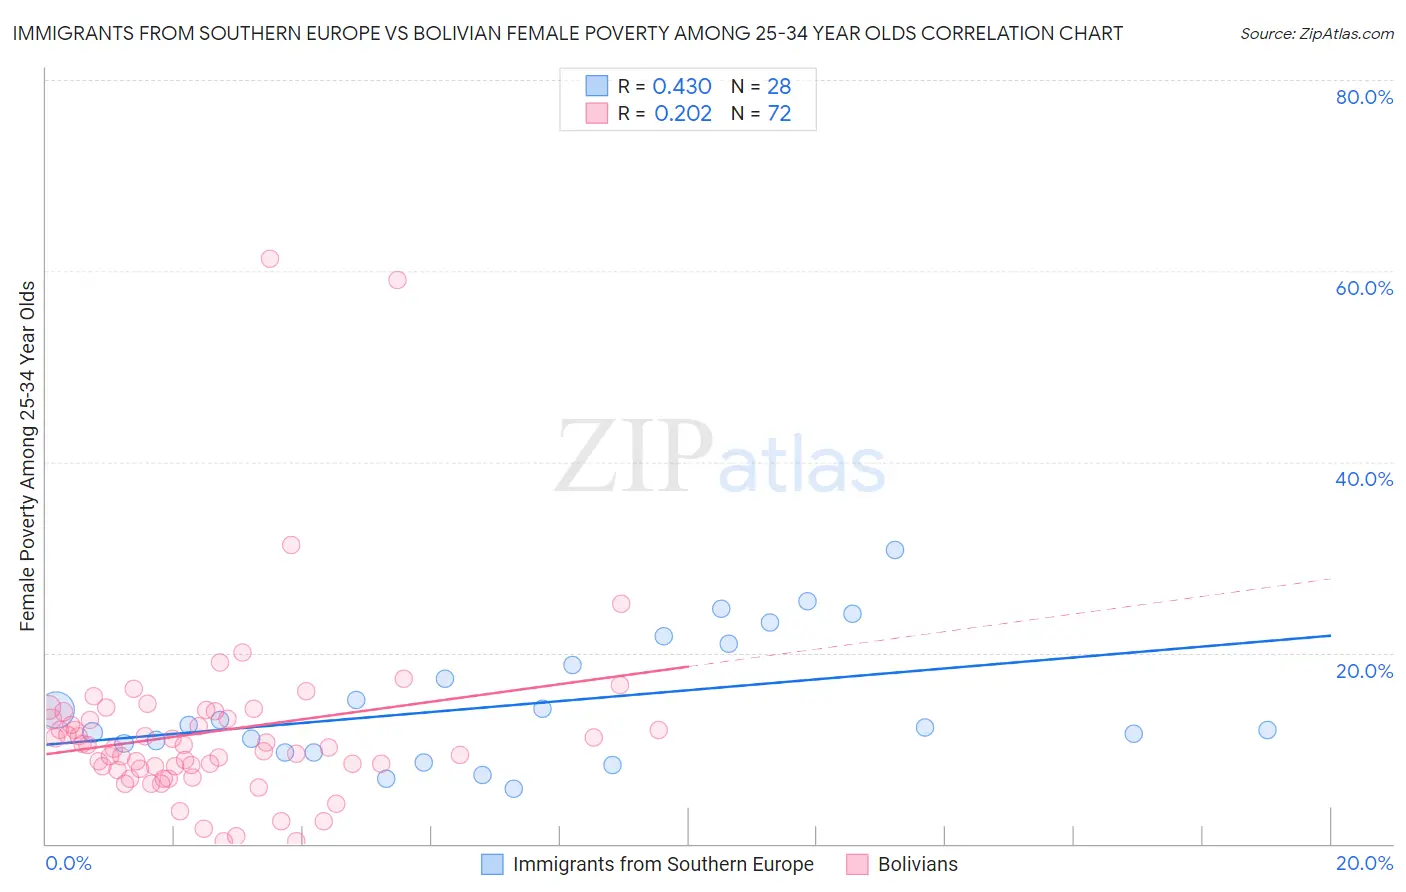
Immigrants from Southern Europe vs Bolivian Female Poverty Among 25-34 Year Olds Correlation Chart
The statistical analysis conducted on geographies consisting of 394,458,133 people shows a moderate positive correlation between the proportion of Immigrants from Southern Europe and poverty level among females between the ages 25 and 34 in the United States with a correlation coefficient (R) of 0.430 and weighted average of 12.8%. Similarly, the statistical analysis conducted on geographies consisting of 183,125,040 people shows a weak positive correlation between the proportion of Bolivians and poverty level among females between the ages 25 and 34 in the United States with a correlation coefficient (R) of 0.202 and weighted average of 11.4%, a difference of 11.9%.
Female Poverty Among 25-34 Year Olds Correlation Summary
| Measurement | Immigrants from Southern Europe | Bolivian |
| Minimum | 5.8% | 0.24% |
| Maximum | 30.8% | 61.3% |
| Range | 25.0% | 61.0% |
| Mean | 14.7% | 11.8% |
| Median | 12.3% | 10.2% |
| Interquartile 25% (IQ1) | 10.0% | 8.0% |
| Interquartile 75% (IQ3) | 19.9% | 13.5% |
| Interquartile Range (IQR) | 9.9% | 5.5% |
| Standard Deviation (Sample) | 6.6% | 9.7% |
| Standard Deviation (Population) | 6.5% | 9.7% |
Similar Demographics by Female Poverty Among 25-34 Year Olds
Demographics Similar to Immigrants from Southern Europe by Female Poverty Among 25-34 Year Olds
In terms of female poverty among 25-34 year olds, the demographic groups most similar to Immigrants from Southern Europe are Immigrants from Syria (12.8%, a difference of 0.070%), Immigrants from Brazil (12.8%, a difference of 0.090%), Immigrants from Morocco (12.8%, a difference of 0.11%), Danish (12.8%, a difference of 0.13%), and Chilean (12.8%, a difference of 0.13%).
| Demographics | Rating | Rank | Female Poverty Among 25-34 Year Olds |
| Poles | 94.9 /100 | #107 | Exceptional 12.7% |
| Immigrants | Norway | 94.4 /100 | #108 | Exceptional 12.7% |
| Immigrants | Peru | 94.3 /100 | #109 | Exceptional 12.7% |
| Australians | 94.1 /100 | #110 | Exceptional 12.8% |
| Danes | 93.9 /100 | #111 | Exceptional 12.8% |
| Immigrants | Morocco | 93.9 /100 | #112 | Exceptional 12.8% |
| Immigrants | Syria | 93.8 /100 | #113 | Exceptional 12.8% |
| Immigrants | Southern Europe | 93.6 /100 | #114 | Exceptional 12.8% |
| Immigrants | Brazil | 93.3 /100 | #115 | Exceptional 12.8% |
| Chileans | 93.2 /100 | #116 | Exceptional 12.8% |
| Immigrants | Kuwait | 93.1 /100 | #117 | Exceptional 12.8% |
| Mongolians | 93.0 /100 | #118 | Exceptional 12.8% |
| Immigrants | Nepal | 93.0 /100 | #119 | Exceptional 12.8% |
| Carpatho Rusyns | 93.0 /100 | #120 | Exceptional 12.8% |
| Romanians | 92.8 /100 | #121 | Exceptional 12.8% |
Demographics Similar to Bolivians by Female Poverty Among 25-34 Year Olds
In terms of female poverty among 25-34 year olds, the demographic groups most similar to Bolivians are Maltese (11.4%, a difference of 0.030%), Asian (11.4%, a difference of 0.060%), Turkish (11.4%, a difference of 0.21%), Bhutanese (11.4%, a difference of 0.25%), and Tongan (11.5%, a difference of 0.40%).
| Demographics | Rating | Rank | Female Poverty Among 25-34 Year Olds |
| Immigrants | Bolivia | 100.0 /100 | #16 | Exceptional 11.2% |
| Immigrants | China | 100.0 /100 | #17 | Exceptional 11.2% |
| Immigrants | Eastern Asia | 100.0 /100 | #18 | Exceptional 11.2% |
| Iranians | 100.0 /100 | #19 | Exceptional 11.2% |
| Okinawans | 100.0 /100 | #20 | Exceptional 11.3% |
| Turks | 100.0 /100 | #21 | Exceptional 11.4% |
| Asians | 99.9 /100 | #22 | Exceptional 11.4% |
| Bolivians | 99.9 /100 | #23 | Exceptional 11.4% |
| Maltese | 99.9 /100 | #24 | Exceptional 11.4% |
| Bhutanese | 99.9 /100 | #25 | Exceptional 11.4% |
| Tongans | 99.9 /100 | #26 | Exceptional 11.5% |
| Immigrants | Greece | 99.9 /100 | #27 | Exceptional 11.5% |
| Immigrants | Pakistan | 99.9 /100 | #28 | Exceptional 11.5% |
| Bulgarians | 99.9 /100 | #29 | Exceptional 11.5% |
| Cypriots | 99.9 /100 | #30 | Exceptional 11.5% |