Immigrants from Southern Europe vs Northern European Vision Disability
COMPARE
Immigrants from Southern Europe
Northern European
Vision Disability
Vision Disability Comparison
Immigrants from Southern Europe
Northern Europeans
2.1%
VISION DISABILITY
74.6/ 100
METRIC RATING
152nd/ 347
METRIC RANK
2.2%
VISION DISABILITY
50.1/ 100
METRIC RATING
172nd/ 347
METRIC RANK
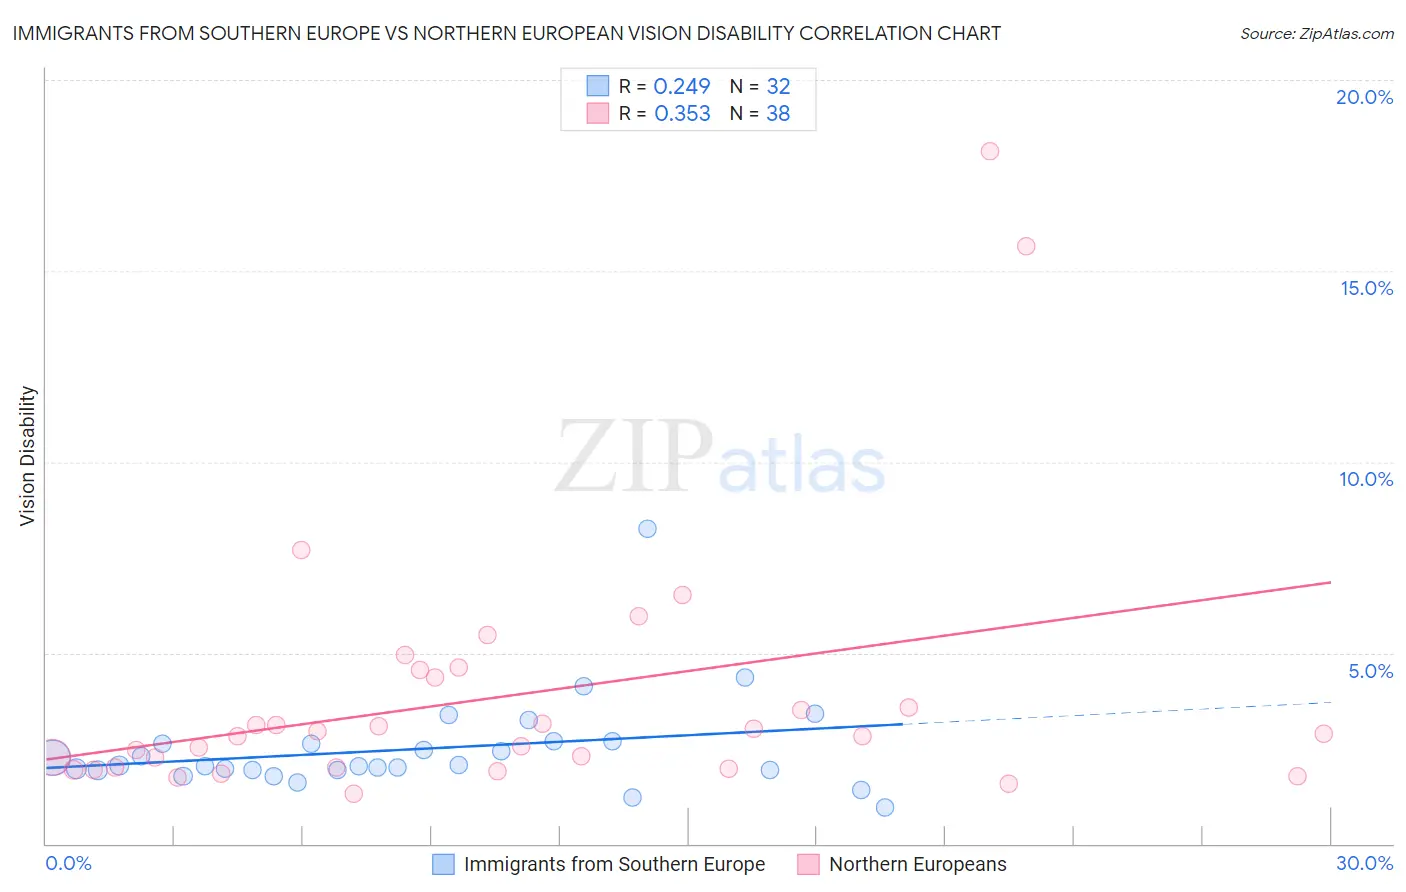
Immigrants from Southern Europe vs Northern European Vision Disability Correlation Chart
The statistical analysis conducted on geographies consisting of 402,373,395 people shows a weak positive correlation between the proportion of Immigrants from Southern Europe and percentage of population with vision disability in the United States with a correlation coefficient (R) of 0.249 and weighted average of 2.1%. Similarly, the statistical analysis conducted on geographies consisting of 405,711,615 people shows a mild positive correlation between the proportion of Northern Europeans and percentage of population with vision disability in the United States with a correlation coefficient (R) of 0.353 and weighted average of 2.2%, a difference of 1.7%.
Vision Disability Correlation Summary
| Measurement | Immigrants from Southern Europe | Northern European |
| Minimum | 0.96% | 1.3% |
| Maximum | 8.3% | 18.1% |
| Range | 7.3% | 16.8% |
| Mean | 2.5% | 3.8% |
| Median | 2.0% | 2.8% |
| Interquartile 25% (IQ1) | 1.9% | 2.0% |
| Interquartile 75% (IQ3) | 2.7% | 4.4% |
| Interquartile Range (IQR) | 0.73% | 2.4% |
| Standard Deviation (Sample) | 1.3% | 3.5% |
| Standard Deviation (Population) | 1.3% | 3.4% |
Demographics Similar to Immigrants from Southern Europe and Northern Europeans by Vision Disability
In terms of vision disability, the demographic groups most similar to Immigrants from Southern Europe are Immigrants from South America (2.1%, a difference of 0.070%), Slovene (2.1%, a difference of 0.080%), Immigrants from Colombia (2.1%, a difference of 0.20%), Pakistani (2.1%, a difference of 0.24%), and Serbian (2.1%, a difference of 0.35%). Similarly, the demographic groups most similar to Northern Europeans are Lebanese (2.2%, a difference of 0.26%), Swiss (2.2%, a difference of 0.36%), South American Indian (2.2%, a difference of 0.47%), Brazilian (2.1%, a difference of 0.79%), and Immigrants from Africa (2.1%, a difference of 0.81%).
| Demographics | Rating | Rank | Vision Disability |
| Immigrants | Southern Europe | 74.6 /100 | #152 | Good 2.1% |
| Immigrants | South America | 73.8 /100 | #153 | Good 2.1% |
| Slovenes | 73.6 /100 | #154 | Good 2.1% |
| Immigrants | Colombia | 72.1 /100 | #155 | Good 2.1% |
| Pakistanis | 71.6 /100 | #156 | Good 2.1% |
| Serbians | 70.2 /100 | #157 | Good 2.1% |
| Immigrants | Uzbekistan | 69.9 /100 | #158 | Good 2.1% |
| South Africans | 69.8 /100 | #159 | Good 2.1% |
| Austrians | 69.0 /100 | #160 | Good 2.1% |
| Iraqis | 67.7 /100 | #161 | Good 2.1% |
| Hungarians | 67.4 /100 | #162 | Good 2.1% |
| Icelanders | 66.1 /100 | #163 | Good 2.1% |
| Immigrants | Bangladesh | 65.5 /100 | #164 | Good 2.1% |
| Immigrants | Iraq | 64.8 /100 | #165 | Good 2.1% |
| Immigrants | England | 62.8 /100 | #166 | Good 2.1% |
| Immigrants | Africa | 62.6 /100 | #167 | Good 2.1% |
| Brazilians | 62.2 /100 | #168 | Good 2.1% |
| South American Indians | 57.4 /100 | #169 | Average 2.2% |
| Swiss | 55.7 /100 | #170 | Average 2.2% |
| Lebanese | 54.3 /100 | #171 | Average 2.2% |
| Northern Europeans | 50.1 /100 | #172 | Average 2.2% |