Immigrants from South Central Asia vs Jordanian 8th Grade
COMPARE
Immigrants from South Central Asia
Jordanian
8th Grade
8th Grade Comparison
Immigrants from South Central Asia
Jordanians
96.1%
8TH GRADE
89.4/ 100
METRIC RATING
140th/ 347
METRIC RANK
96.1%
8TH GRADE
91.3/ 100
METRIC RATING
136th/ 347
METRIC RANK
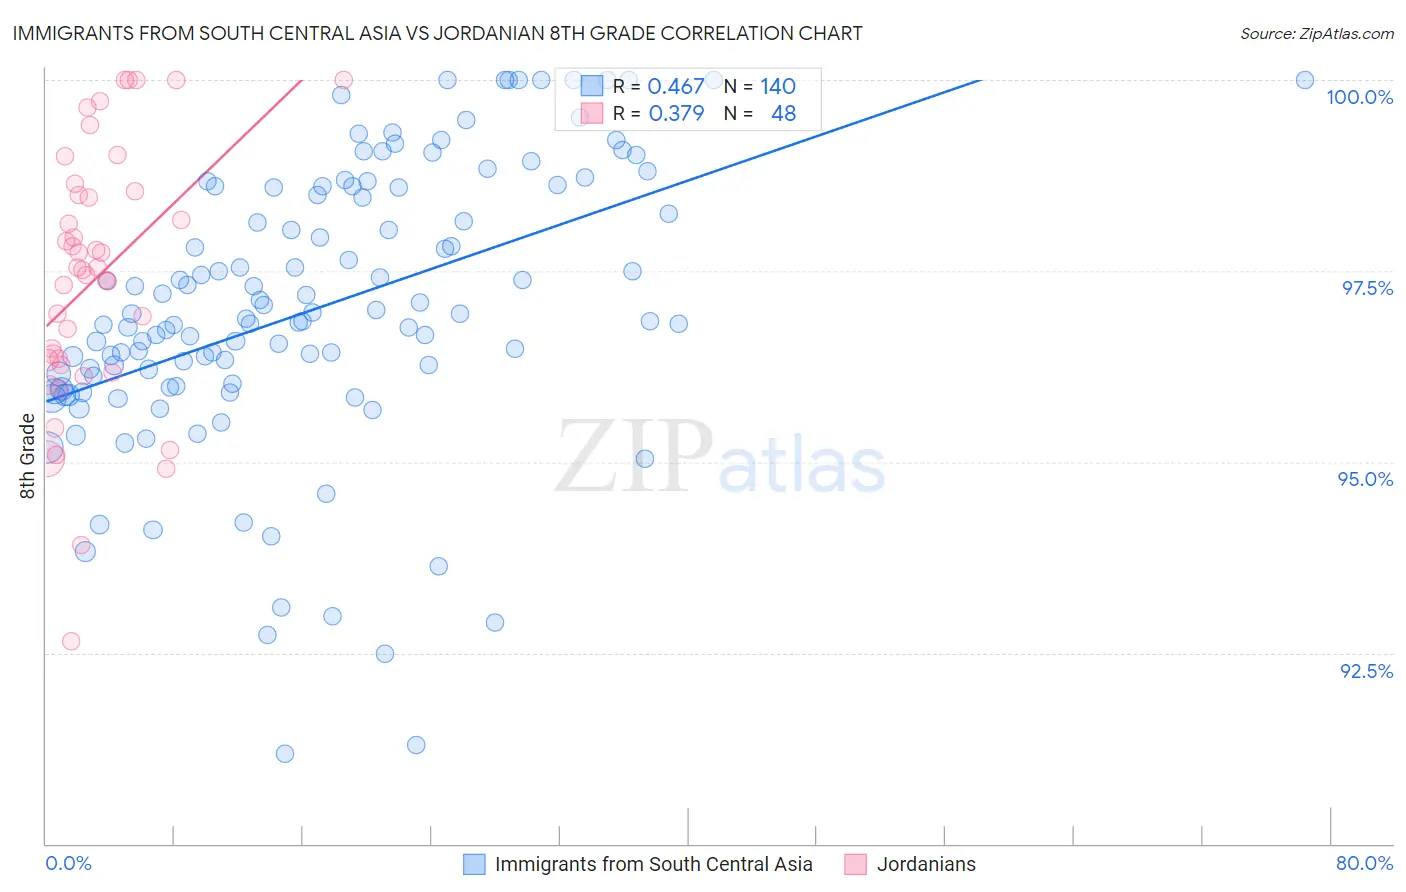
Immigrants from South Central Asia vs Jordanian 8th Grade Correlation Chart
The statistical analysis conducted on geographies consisting of 473,113,181 people shows a moderate positive correlation between the proportion of Immigrants from South Central Asia and percentage of population with at least 8th grade education in the United States with a correlation coefficient (R) of 0.467 and weighted average of 96.1%. Similarly, the statistical analysis conducted on geographies consisting of 166,403,553 people shows a mild positive correlation between the proportion of Jordanians and percentage of population with at least 8th grade education in the United States with a correlation coefficient (R) of 0.379 and weighted average of 96.1%, a difference of 0.040%.
8th Grade Correlation Summary
| Measurement | Immigrants from South Central Asia | Jordanian |
| Minimum | 91.2% | 92.6% |
| Maximum | 100.0% | 100.0% |
| Range | 8.8% | 7.4% |
| Mean | 97.0% | 97.4% |
| Median | 96.9% | 97.5% |
| Interquartile 25% (IQ1) | 96.0% | 96.3% |
| Interquartile 75% (IQ3) | 98.6% | 98.5% |
| Interquartile Range (IQR) | 2.6% | 2.2% |
| Standard Deviation (Sample) | 1.8% | 1.7% |
| Standard Deviation (Population) | 1.8% | 1.7% |
Demographics Similar to Immigrants from South Central Asia and Jordanians by 8th Grade
In terms of 8th grade, the demographic groups most similar to Immigrants from South Central Asia are Burmese (96.1%, a difference of 0.010%), Hmong (96.1%, a difference of 0.010%), Cambodian (96.1%, a difference of 0.020%), Immigrants from Turkey (96.1%, a difference of 0.040%), and Immigrants from Hungary (96.1%, a difference of 0.040%). Similarly, the demographic groups most similar to Jordanians are Immigrants from Hungary (96.1%, a difference of 0.0%), Basque (96.1%, a difference of 0.0%), Immigrants from Turkey (96.1%, a difference of 0.010%), Cambodian (96.1%, a difference of 0.010%), and Pueblo (96.1%, a difference of 0.020%).
| Demographics | Rating | Rank | 8th Grade |
| Immigrants | Bosnia and Herzegovina | 93.9 /100 | #128 | Exceptional 96.2% |
| Cheyenne | 93.3 /100 | #129 | Exceptional 96.1% |
| Soviet Union | 92.6 /100 | #130 | Exceptional 96.1% |
| Pueblo | 92.3 /100 | #131 | Exceptional 96.1% |
| Immigrants | Kuwait | 92.2 /100 | #132 | Exceptional 96.1% |
| Immigrants | Turkey | 91.7 /100 | #133 | Exceptional 96.1% |
| Immigrants | Hungary | 91.5 /100 | #134 | Exceptional 96.1% |
| Basques | 91.5 /100 | #135 | Exceptional 96.1% |
| Jordanians | 91.3 /100 | #136 | Exceptional 96.1% |
| Cambodians | 90.6 /100 | #137 | Exceptional 96.1% |
| Burmese | 90.2 /100 | #138 | Exceptional 96.1% |
| Hmong | 89.7 /100 | #139 | Excellent 96.1% |
| Immigrants | South Central Asia | 89.4 /100 | #140 | Excellent 96.1% |
| Immigrants | Greece | 85.9 /100 | #141 | Excellent 96.0% |
| Immigrants | Eastern Europe | 85.4 /100 | #142 | Excellent 96.0% |
| Spanish | 85.1 /100 | #143 | Excellent 96.0% |
| Immigrants | Belarus | 84.8 /100 | #144 | Excellent 96.0% |
| Lumbee | 84.1 /100 | #145 | Excellent 96.0% |
| Israelis | 84.1 /100 | #146 | Excellent 96.0% |
| Colville | 84.0 /100 | #147 | Excellent 96.0% |
| Albanians | 83.1 /100 | #148 | Excellent 96.0% |