Immigrants from South Central Asia vs Hmong Seniors Poverty Over the Age of 65
COMPARE
Immigrants from South Central Asia
Hmong
Seniors Poverty Over the Age of 65
Seniors Poverty Over the Age of 65 Comparison
Immigrants from South Central Asia
Hmong
9.7%
SENIORS POVERTY OVER THE AGE OF 65
99.5/ 100
METRIC RATING
47th/ 347
METRIC RANK
10.4%
SENIORS POVERTY OVER THE AGE OF 65
90.0/ 100
METRIC RATING
123rd/ 347
METRIC RANK
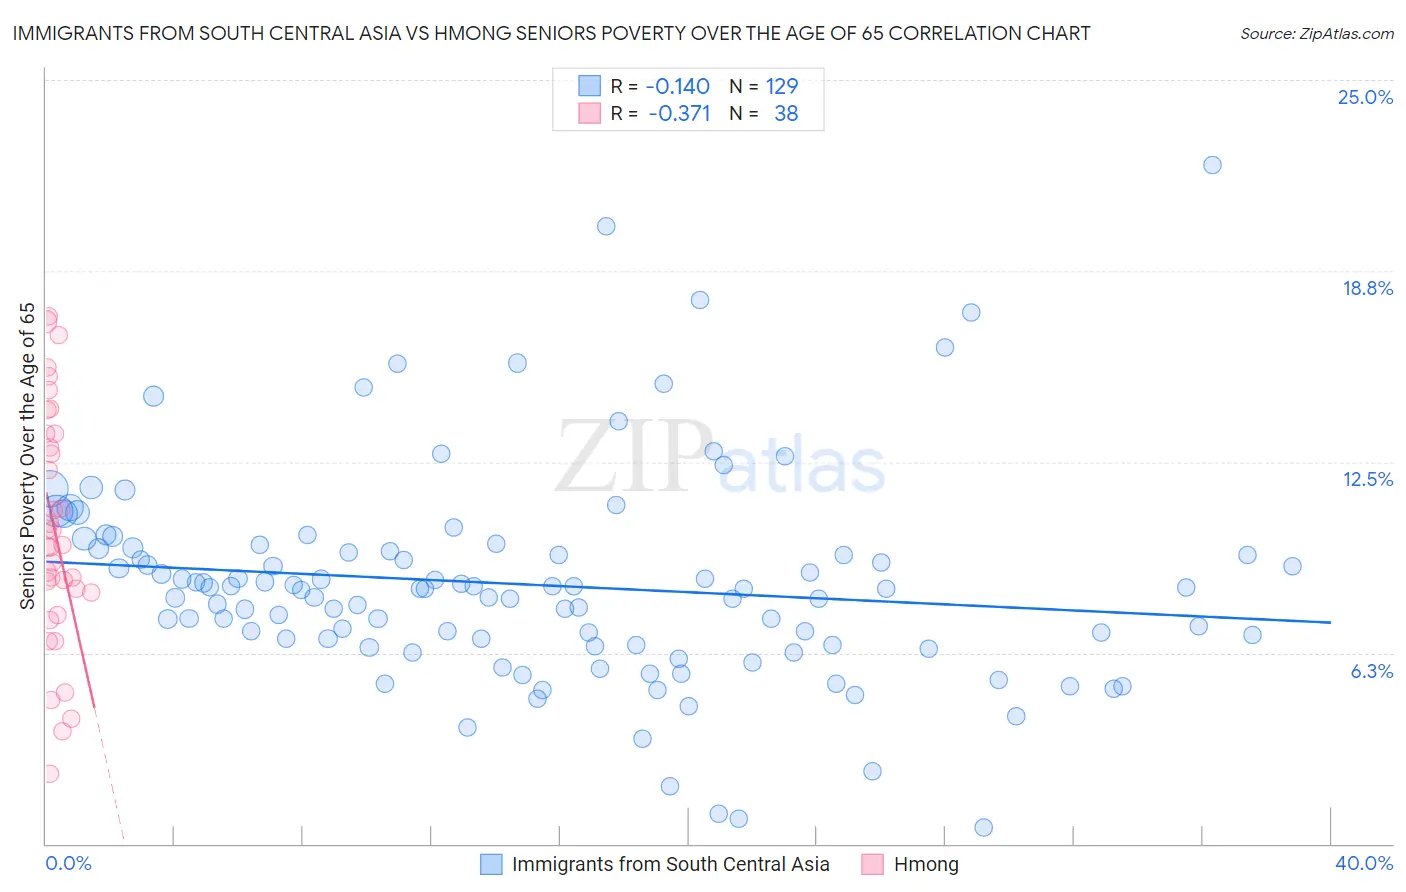
Immigrants from South Central Asia vs Hmong Seniors Poverty Over the Age of 65 Correlation Chart
The statistical analysis conducted on geographies consisting of 470,727,560 people shows a poor negative correlation between the proportion of Immigrants from South Central Asia and poverty level among seniors over the age of 65 in the United States with a correlation coefficient (R) of -0.140 and weighted average of 9.7%. Similarly, the statistical analysis conducted on geographies consisting of 24,669,739 people shows a mild negative correlation between the proportion of Hmong and poverty level among seniors over the age of 65 in the United States with a correlation coefficient (R) of -0.371 and weighted average of 10.4%, a difference of 7.7%.
Seniors Poverty Over the Age of 65 Correlation Summary
| Measurement | Immigrants from South Central Asia | Hmong |
| Minimum | 0.53% | 2.3% |
| Maximum | 22.2% | 17.3% |
| Range | 21.7% | 15.0% |
| Mean | 8.5% | 10.2% |
| Median | 8.4% | 9.7% |
| Interquartile 25% (IQ1) | 6.5% | 8.2% |
| Interquartile 75% (IQ3) | 9.6% | 13.4% |
| Interquartile Range (IQR) | 3.1% | 5.2% |
| Standard Deviation (Sample) | 3.5% | 3.9% |
| Standard Deviation (Population) | 3.5% | 3.8% |
Similar Demographics by Seniors Poverty Over the Age of 65
Demographics Similar to Immigrants from South Central Asia by Seniors Poverty Over the Age of 65
In terms of seniors poverty over the age of 65, the demographic groups most similar to Immigrants from South Central Asia are Immigrants from Taiwan (9.7%, a difference of 0.010%), French (9.7%, a difference of 0.11%), Estonian (9.6%, a difference of 0.15%), Immigrants from Lithuania (9.7%, a difference of 0.17%), and Austrian (9.6%, a difference of 0.33%).
| Demographics | Rating | Rank | Seniors Poverty Over the Age of 65 |
| Assyrians/Chaldeans/Syriacs | 99.6 /100 | #40 | Exceptional 9.6% |
| Immigrants | North Macedonia | 99.6 /100 | #41 | Exceptional 9.6% |
| Zimbabweans | 99.6 /100 | #42 | Exceptional 9.6% |
| Eastern Europeans | 99.6 /100 | #43 | Exceptional 9.6% |
| Austrians | 99.5 /100 | #44 | Exceptional 9.6% |
| Estonians | 99.5 /100 | #45 | Exceptional 9.6% |
| Immigrants | Taiwan | 99.5 /100 | #46 | Exceptional 9.7% |
| Immigrants | South Central Asia | 99.5 /100 | #47 | Exceptional 9.7% |
| French | 99.5 /100 | #48 | Exceptional 9.7% |
| Immigrants | Lithuania | 99.4 /100 | #49 | Exceptional 9.7% |
| Hungarians | 99.4 /100 | #50 | Exceptional 9.7% |
| Carpatho Rusyns | 99.3 /100 | #51 | Exceptional 9.7% |
| Filipinos | 99.3 /100 | #52 | Exceptional 9.7% |
| Slavs | 99.2 /100 | #53 | Exceptional 9.8% |
| Immigrants | Northern Europe | 99.2 /100 | #54 | Exceptional 9.8% |
Demographics Similar to Hmong by Seniors Poverty Over the Age of 65
In terms of seniors poverty over the age of 65, the demographic groups most similar to Hmong are Asian (10.4%, a difference of 0.030%), Immigrants from Philippines (10.4%, a difference of 0.17%), Immigrants from Iraq (10.4%, a difference of 0.18%), Immigrants from Moldova (10.4%, a difference of 0.18%), and Immigrants from Bosnia and Herzegovina (10.4%, a difference of 0.22%).
| Demographics | Rating | Rank | Seniors Poverty Over the Age of 65 |
| Pakistanis | 92.2 /100 | #116 | Exceptional 10.3% |
| Lebanese | 92.0 /100 | #117 | Exceptional 10.3% |
| Okinawans | 91.7 /100 | #118 | Exceptional 10.4% |
| Immigrants | Western Europe | 91.1 /100 | #119 | Exceptional 10.4% |
| Immigrants | Bosnia and Herzegovina | 90.8 /100 | #120 | Exceptional 10.4% |
| Immigrants | Iraq | 90.7 /100 | #121 | Exceptional 10.4% |
| Immigrants | Moldova | 90.7 /100 | #122 | Exceptional 10.4% |
| Hmong | 90.0 /100 | #123 | Exceptional 10.4% |
| Asians | 89.9 /100 | #124 | Excellent 10.4% |
| Immigrants | Philippines | 89.4 /100 | #125 | Excellent 10.4% |
| Immigrants | Hungary | 89.1 /100 | #126 | Excellent 10.4% |
| Cambodians | 89.1 /100 | #127 | Excellent 10.4% |
| Ottawa | 88.5 /100 | #128 | Excellent 10.4% |
| Immigrants | Iran | 88.4 /100 | #129 | Excellent 10.4% |
| Immigrants | Oceania | 88.4 /100 | #130 | Excellent 10.4% |