Cape Verdean vs Hmong Seniors Poverty Over the Age of 65
COMPARE
Cape Verdean
Hmong
Seniors Poverty Over the Age of 65
Seniors Poverty Over the Age of 65 Comparison
Cape Verdeans
Hmong
14.7%
SENIORS POVERTY OVER THE AGE OF 65
0.0/ 100
METRIC RATING
319th/ 347
METRIC RANK
10.4%
SENIORS POVERTY OVER THE AGE OF 65
90.0/ 100
METRIC RATING
123rd/ 347
METRIC RANK
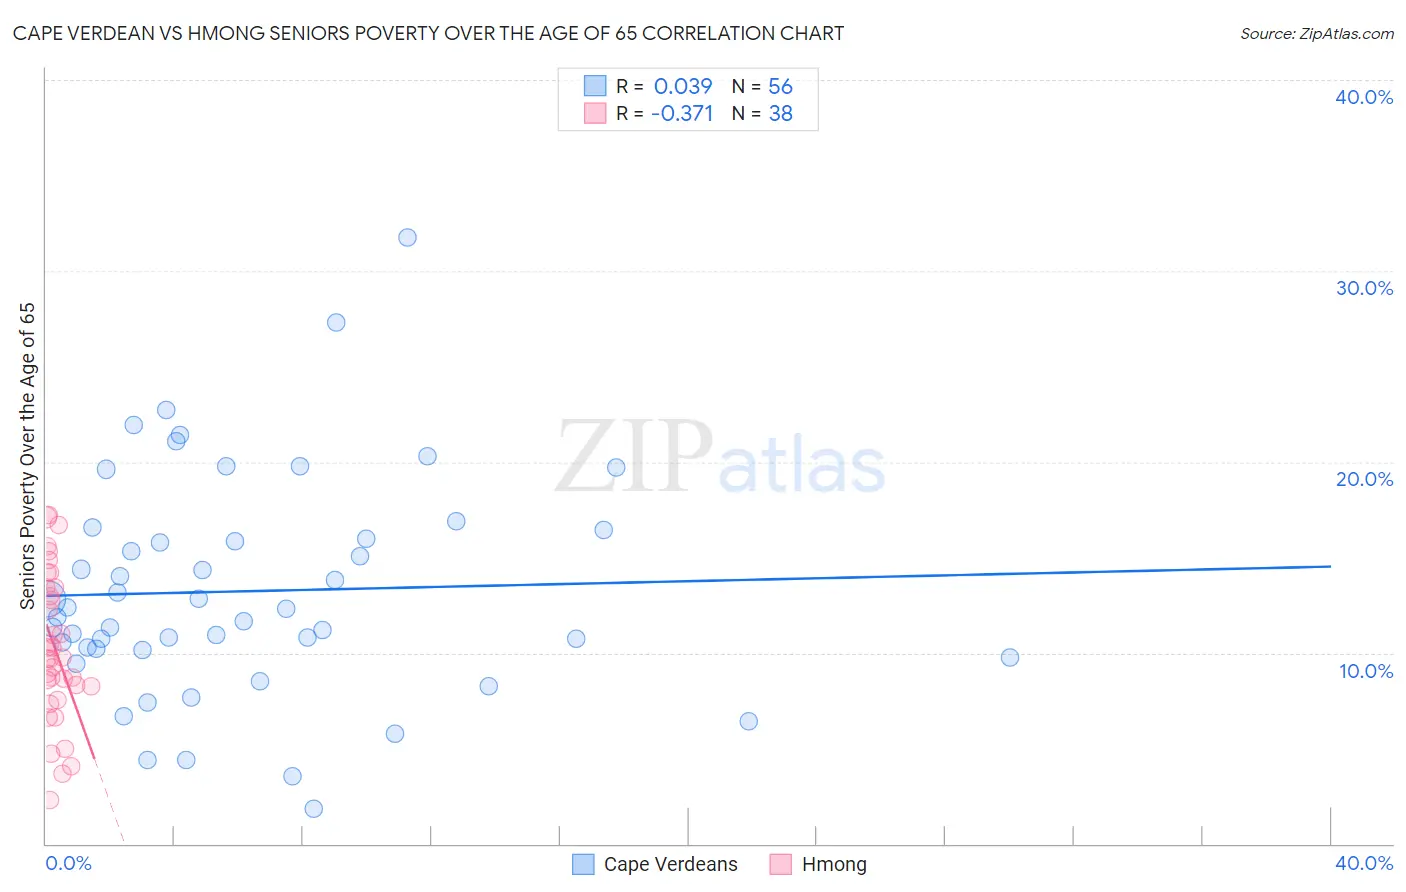
Cape Verdean vs Hmong Seniors Poverty Over the Age of 65 Correlation Chart
The statistical analysis conducted on geographies consisting of 107,426,458 people shows no correlation between the proportion of Cape Verdeans and poverty level among seniors over the age of 65 in the United States with a correlation coefficient (R) of 0.039 and weighted average of 14.7%. Similarly, the statistical analysis conducted on geographies consisting of 24,669,739 people shows a mild negative correlation between the proportion of Hmong and poverty level among seniors over the age of 65 in the United States with a correlation coefficient (R) of -0.371 and weighted average of 10.4%, a difference of 41.0%.
Seniors Poverty Over the Age of 65 Correlation Summary
| Measurement | Cape Verdean | Hmong |
| Minimum | 1.9% | 2.3% |
| Maximum | 31.7% | 17.3% |
| Range | 29.9% | 15.0% |
| Mean | 13.2% | 10.2% |
| Median | 12.1% | 9.7% |
| Interquartile 25% (IQ1) | 10.2% | 8.2% |
| Interquartile 75% (IQ3) | 16.2% | 13.4% |
| Interquartile Range (IQR) | 6.1% | 5.2% |
| Standard Deviation (Sample) | 5.8% | 3.9% |
| Standard Deviation (Population) | 5.8% | 3.8% |
Similar Demographics by Seniors Poverty Over the Age of 65
Demographics Similar to Cape Verdeans by Seniors Poverty Over the Age of 65
In terms of seniors poverty over the age of 65, the demographic groups most similar to Cape Verdeans are Immigrants from Haiti (14.7%, a difference of 0.18%), Houma (14.7%, a difference of 0.39%), Immigrants from Barbados (14.8%, a difference of 0.78%), Yakama (14.8%, a difference of 0.93%), and Immigrants from Honduras (14.5%, a difference of 1.2%).
| Demographics | Rating | Rank | Seniors Poverty Over the Age of 65 |
| Hispanics or Latinos | 0.0 /100 | #312 | Tragic 14.3% |
| Barbadians | 0.0 /100 | #313 | Tragic 14.4% |
| Guyanese | 0.0 /100 | #314 | Tragic 14.4% |
| Immigrants | Ecuador | 0.0 /100 | #315 | Tragic 14.4% |
| Immigrants | Guyana | 0.0 /100 | #316 | Tragic 14.5% |
| Haitians | 0.0 /100 | #317 | Tragic 14.5% |
| Immigrants | Honduras | 0.0 /100 | #318 | Tragic 14.5% |
| Cape Verdeans | 0.0 /100 | #319 | Tragic 14.7% |
| Immigrants | Haiti | 0.0 /100 | #320 | Tragic 14.7% |
| Houma | 0.0 /100 | #321 | Tragic 14.7% |
| Immigrants | Barbados | 0.0 /100 | #322 | Tragic 14.8% |
| Yakama | 0.0 /100 | #323 | Tragic 14.8% |
| Nicaraguans | 0.0 /100 | #324 | Tragic 15.0% |
| Central American Indians | 0.0 /100 | #325 | Tragic 15.1% |
| Immigrants | Armenia | 0.0 /100 | #326 | Tragic 15.2% |
Demographics Similar to Hmong by Seniors Poverty Over the Age of 65
In terms of seniors poverty over the age of 65, the demographic groups most similar to Hmong are Asian (10.4%, a difference of 0.030%), Immigrants from Philippines (10.4%, a difference of 0.17%), Immigrants from Iraq (10.4%, a difference of 0.18%), Immigrants from Moldova (10.4%, a difference of 0.18%), and Immigrants from Bosnia and Herzegovina (10.4%, a difference of 0.22%).
| Demographics | Rating | Rank | Seniors Poverty Over the Age of 65 |
| Pakistanis | 92.2 /100 | #116 | Exceptional 10.3% |
| Lebanese | 92.0 /100 | #117 | Exceptional 10.3% |
| Okinawans | 91.7 /100 | #118 | Exceptional 10.4% |
| Immigrants | Western Europe | 91.1 /100 | #119 | Exceptional 10.4% |
| Immigrants | Bosnia and Herzegovina | 90.8 /100 | #120 | Exceptional 10.4% |
| Immigrants | Iraq | 90.7 /100 | #121 | Exceptional 10.4% |
| Immigrants | Moldova | 90.7 /100 | #122 | Exceptional 10.4% |
| Hmong | 90.0 /100 | #123 | Exceptional 10.4% |
| Asians | 89.9 /100 | #124 | Excellent 10.4% |
| Immigrants | Philippines | 89.4 /100 | #125 | Excellent 10.4% |
| Immigrants | Hungary | 89.1 /100 | #126 | Excellent 10.4% |
| Cambodians | 89.1 /100 | #127 | Excellent 10.4% |
| Ottawa | 88.5 /100 | #128 | Excellent 10.4% |
| Immigrants | Iran | 88.4 /100 | #129 | Excellent 10.4% |
| Immigrants | Oceania | 88.4 /100 | #130 | Excellent 10.4% |