Immigrants from South Central Asia vs Immigrants from Trinidad and Tobago Seniors Poverty Over the Age of 65
COMPARE
Immigrants from South Central Asia
Immigrants from Trinidad and Tobago
Seniors Poverty Over the Age of 65
Seniors Poverty Over the Age of 65 Comparison
Immigrants from South Central Asia
Immigrants from Trinidad and Tobago
9.7%
SENIORS POVERTY OVER THE AGE OF 65
99.5/ 100
METRIC RATING
47th/ 347
METRIC RANK
14.1%
SENIORS POVERTY OVER THE AGE OF 65
0.0/ 100
METRIC RATING
305th/ 347
METRIC RANK
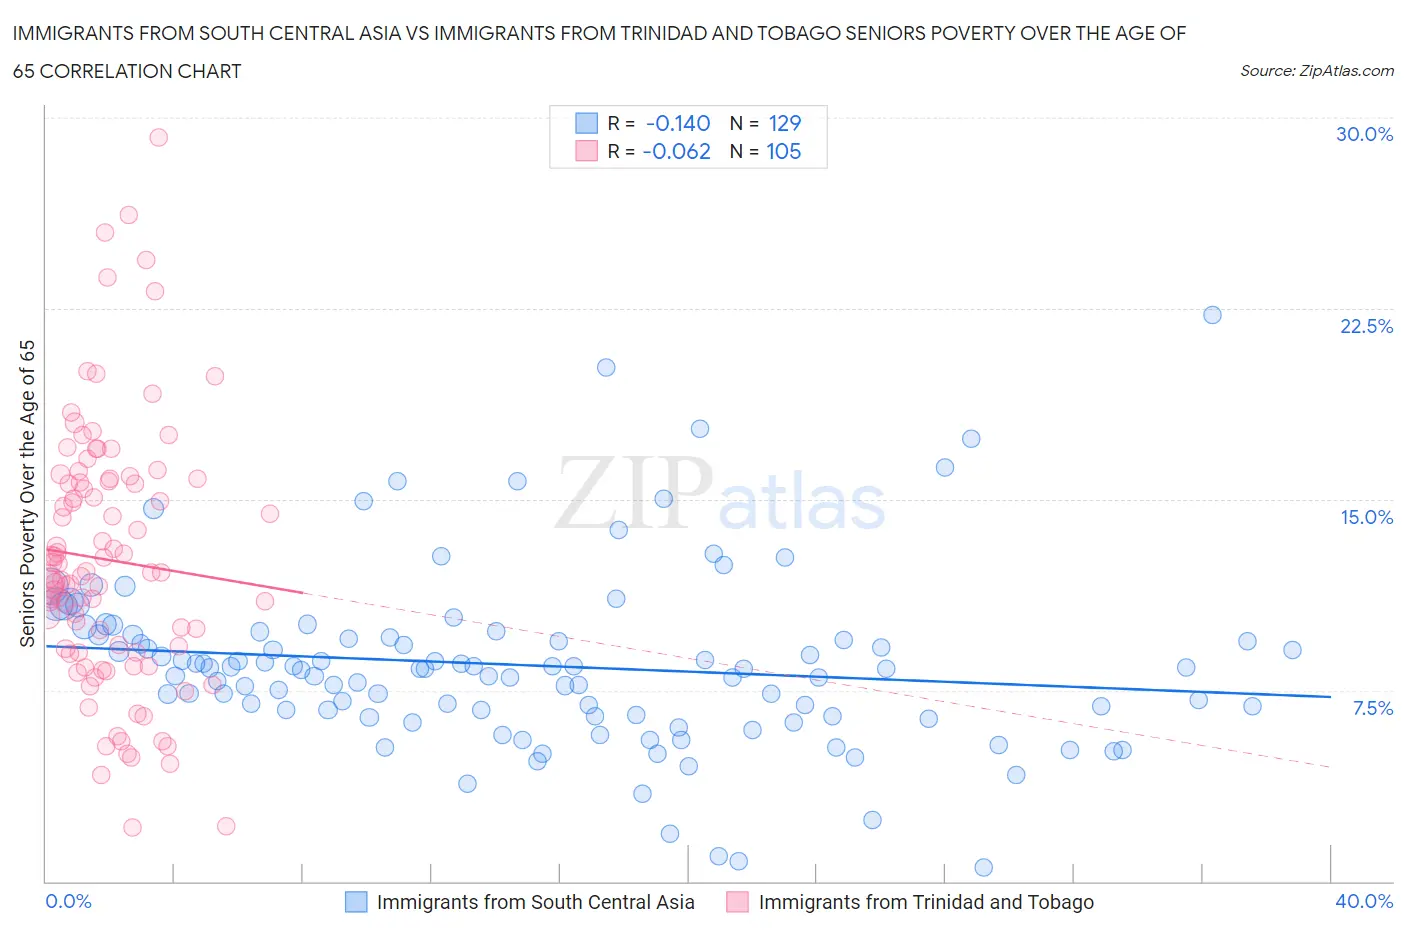
Immigrants from South Central Asia vs Immigrants from Trinidad and Tobago Seniors Poverty Over the Age of 65 Correlation Chart
The statistical analysis conducted on geographies consisting of 470,727,560 people shows a poor negative correlation between the proportion of Immigrants from South Central Asia and poverty level among seniors over the age of 65 in the United States with a correlation coefficient (R) of -0.140 and weighted average of 9.7%. Similarly, the statistical analysis conducted on geographies consisting of 223,119,886 people shows a slight negative correlation between the proportion of Immigrants from Trinidad and Tobago and poverty level among seniors over the age of 65 in the United States with a correlation coefficient (R) of -0.062 and weighted average of 14.1%, a difference of 46.1%.
Seniors Poverty Over the Age of 65 Correlation Summary
| Measurement | Immigrants from South Central Asia | Immigrants from Trinidad and Tobago |
| Minimum | 0.53% | 2.1% |
| Maximum | 22.2% | 29.2% |
| Range | 21.7% | 27.1% |
| Mean | 8.5% | 12.6% |
| Median | 8.4% | 12.1% |
| Interquartile 25% (IQ1) | 6.5% | 9.0% |
| Interquartile 75% (IQ3) | 9.6% | 15.8% |
| Interquartile Range (IQR) | 3.1% | 6.8% |
| Standard Deviation (Sample) | 3.5% | 5.2% |
| Standard Deviation (Population) | 3.5% | 5.1% |
Similar Demographics by Seniors Poverty Over the Age of 65
Demographics Similar to Immigrants from South Central Asia by Seniors Poverty Over the Age of 65
In terms of seniors poverty over the age of 65, the demographic groups most similar to Immigrants from South Central Asia are Immigrants from Taiwan (9.7%, a difference of 0.010%), French (9.7%, a difference of 0.11%), Estonian (9.6%, a difference of 0.15%), Immigrants from Lithuania (9.7%, a difference of 0.17%), and Austrian (9.6%, a difference of 0.33%).
| Demographics | Rating | Rank | Seniors Poverty Over the Age of 65 |
| Assyrians/Chaldeans/Syriacs | 99.6 /100 | #40 | Exceptional 9.6% |
| Immigrants | North Macedonia | 99.6 /100 | #41 | Exceptional 9.6% |
| Zimbabweans | 99.6 /100 | #42 | Exceptional 9.6% |
| Eastern Europeans | 99.6 /100 | #43 | Exceptional 9.6% |
| Austrians | 99.5 /100 | #44 | Exceptional 9.6% |
| Estonians | 99.5 /100 | #45 | Exceptional 9.6% |
| Immigrants | Taiwan | 99.5 /100 | #46 | Exceptional 9.7% |
| Immigrants | South Central Asia | 99.5 /100 | #47 | Exceptional 9.7% |
| French | 99.5 /100 | #48 | Exceptional 9.7% |
| Immigrants | Lithuania | 99.4 /100 | #49 | Exceptional 9.7% |
| Hungarians | 99.4 /100 | #50 | Exceptional 9.7% |
| Carpatho Rusyns | 99.3 /100 | #51 | Exceptional 9.7% |
| Filipinos | 99.3 /100 | #52 | Exceptional 9.7% |
| Slavs | 99.2 /100 | #53 | Exceptional 9.8% |
| Immigrants | Northern Europe | 99.2 /100 | #54 | Exceptional 9.8% |
Demographics Similar to Immigrants from Trinidad and Tobago by Seniors Poverty Over the Age of 65
In terms of seniors poverty over the age of 65, the demographic groups most similar to Immigrants from Trinidad and Tobago are West Indian (14.1%, a difference of 0.060%), Immigrants from Bangladesh (14.1%, a difference of 0.30%), Immigrants from Latin America (14.2%, a difference of 0.30%), Yup'ik (14.1%, a difference of 0.41%), and Immigrants from West Indies (14.2%, a difference of 0.44%).
| Demographics | Rating | Rank | Seniors Poverty Over the Age of 65 |
| Immigrants | Belize | 0.0 /100 | #298 | Tragic 14.0% |
| Ecuadorians | 0.0 /100 | #299 | Tragic 14.0% |
| Immigrants | Uzbekistan | 0.0 /100 | #300 | Tragic 14.0% |
| U.S. Virgin Islanders | 0.0 /100 | #301 | Tragic 14.0% |
| Yup'ik | 0.0 /100 | #302 | Tragic 14.1% |
| Immigrants | Bangladesh | 0.0 /100 | #303 | Tragic 14.1% |
| West Indians | 0.0 /100 | #304 | Tragic 14.1% |
| Immigrants | Trinidad and Tobago | 0.0 /100 | #305 | Tragic 14.1% |
| Immigrants | Latin America | 0.0 /100 | #306 | Tragic 14.2% |
| Immigrants | West Indies | 0.0 /100 | #307 | Tragic 14.2% |
| Trinidadians and Tobagonians | 0.0 /100 | #308 | Tragic 14.2% |
| Hondurans | 0.0 /100 | #309 | Tragic 14.2% |
| Bahamians | 0.0 /100 | #310 | Tragic 14.2% |
| Natives/Alaskans | 0.0 /100 | #311 | Tragic 14.2% |
| Hispanics or Latinos | 0.0 /100 | #312 | Tragic 14.3% |