Immigrants from South Central Asia vs Burmese Seniors Poverty Over the Age of 65
COMPARE
Immigrants from South Central Asia
Burmese
Seniors Poverty Over the Age of 65
Seniors Poverty Over the Age of 65 Comparison
Immigrants from South Central Asia
Burmese
9.7%
SENIORS POVERTY OVER THE AGE OF 65
99.5/ 100
METRIC RATING
47th/ 347
METRIC RANK
10.1%
SENIORS POVERTY OVER THE AGE OF 65
97.2/ 100
METRIC RATING
87th/ 347
METRIC RANK
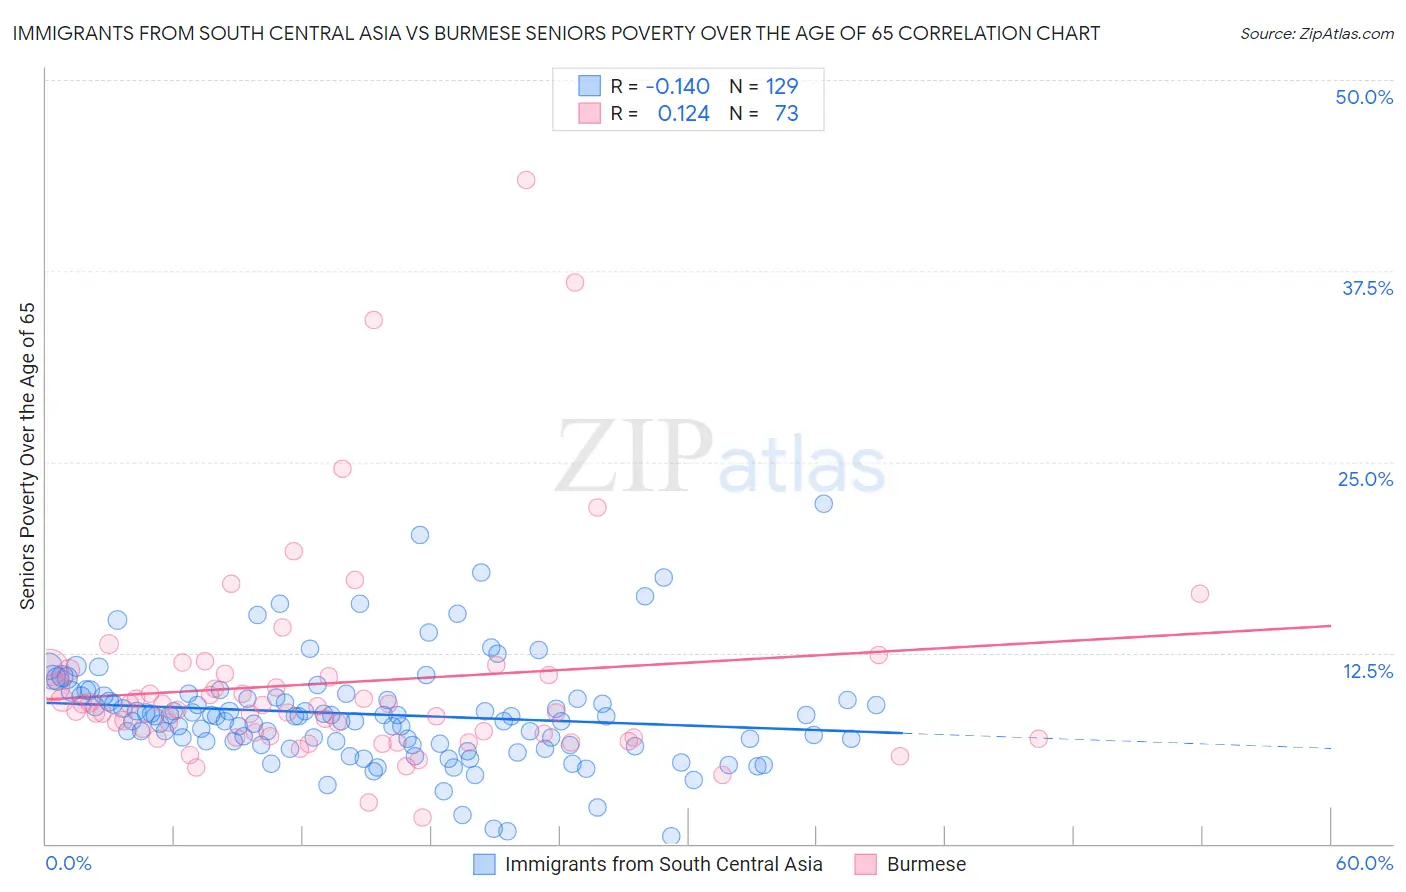
Immigrants from South Central Asia vs Burmese Seniors Poverty Over the Age of 65 Correlation Chart
The statistical analysis conducted on geographies consisting of 470,727,560 people shows a poor negative correlation between the proportion of Immigrants from South Central Asia and poverty level among seniors over the age of 65 in the United States with a correlation coefficient (R) of -0.140 and weighted average of 9.7%. Similarly, the statistical analysis conducted on geographies consisting of 462,767,896 people shows a poor positive correlation between the proportion of Burmese and poverty level among seniors over the age of 65 in the United States with a correlation coefficient (R) of 0.124 and weighted average of 10.1%, a difference of 4.3%.
Seniors Poverty Over the Age of 65 Correlation Summary
| Measurement | Immigrants from South Central Asia | Burmese |
| Minimum | 0.53% | 1.7% |
| Maximum | 22.2% | 43.5% |
| Range | 21.7% | 41.8% |
| Mean | 8.5% | 10.5% |
| Median | 8.4% | 8.7% |
| Interquartile 25% (IQ1) | 6.5% | 7.0% |
| Interquartile 75% (IQ3) | 9.6% | 11.1% |
| Interquartile Range (IQR) | 3.1% | 4.1% |
| Standard Deviation (Sample) | 3.5% | 7.0% |
| Standard Deviation (Population) | 3.5% | 6.9% |
Similar Demographics by Seniors Poverty Over the Age of 65
Demographics Similar to Immigrants from South Central Asia by Seniors Poverty Over the Age of 65
In terms of seniors poverty over the age of 65, the demographic groups most similar to Immigrants from South Central Asia are Immigrants from Taiwan (9.7%, a difference of 0.010%), French (9.7%, a difference of 0.11%), Estonian (9.6%, a difference of 0.15%), Immigrants from Lithuania (9.7%, a difference of 0.17%), and Austrian (9.6%, a difference of 0.33%).
| Demographics | Rating | Rank | Seniors Poverty Over the Age of 65 |
| Assyrians/Chaldeans/Syriacs | 99.6 /100 | #40 | Exceptional 9.6% |
| Immigrants | North Macedonia | 99.6 /100 | #41 | Exceptional 9.6% |
| Zimbabweans | 99.6 /100 | #42 | Exceptional 9.6% |
| Eastern Europeans | 99.6 /100 | #43 | Exceptional 9.6% |
| Austrians | 99.5 /100 | #44 | Exceptional 9.6% |
| Estonians | 99.5 /100 | #45 | Exceptional 9.6% |
| Immigrants | Taiwan | 99.5 /100 | #46 | Exceptional 9.7% |
| Immigrants | South Central Asia | 99.5 /100 | #47 | Exceptional 9.7% |
| French | 99.5 /100 | #48 | Exceptional 9.7% |
| Immigrants | Lithuania | 99.4 /100 | #49 | Exceptional 9.7% |
| Hungarians | 99.4 /100 | #50 | Exceptional 9.7% |
| Carpatho Rusyns | 99.3 /100 | #51 | Exceptional 9.7% |
| Filipinos | 99.3 /100 | #52 | Exceptional 9.7% |
| Slavs | 99.2 /100 | #53 | Exceptional 9.8% |
| Immigrants | Northern Europe | 99.2 /100 | #54 | Exceptional 9.8% |
Demographics Similar to Burmese by Seniors Poverty Over the Age of 65
In terms of seniors poverty over the age of 65, the demographic groups most similar to Burmese are Romanian (10.1%, a difference of 0.020%), Immigrants from Afghanistan (10.1%, a difference of 0.040%), Immigrants from Nepal (10.1%, a difference of 0.040%), Jordanian (10.1%, a difference of 0.050%), and Immigrants from Poland (10.1%, a difference of 0.060%).
| Demographics | Rating | Rank | Seniors Poverty Over the Age of 65 |
| Koreans | 97.4 /100 | #80 | Exceptional 10.1% |
| Immigrants | Sri Lanka | 97.3 /100 | #81 | Exceptional 10.1% |
| Immigrants | Bolivia | 97.3 /100 | #82 | Exceptional 10.1% |
| Immigrants | Poland | 97.2 /100 | #83 | Exceptional 10.1% |
| Immigrants | Afghanistan | 97.2 /100 | #84 | Exceptional 10.1% |
| Immigrants | Nepal | 97.2 /100 | #85 | Exceptional 10.1% |
| Romanians | 97.2 /100 | #86 | Exceptional 10.1% |
| Burmese | 97.2 /100 | #87 | Exceptional 10.1% |
| Jordanians | 97.1 /100 | #88 | Exceptional 10.1% |
| Immigrants | Bulgaria | 97.0 /100 | #89 | Exceptional 10.1% |
| Ukrainians | 96.9 /100 | #90 | Exceptional 10.1% |
| Puget Sound Salish | 96.9 /100 | #91 | Exceptional 10.1% |
| Immigrants | Singapore | 96.9 /100 | #92 | Exceptional 10.1% |
| Immigrants | Sweden | 96.7 /100 | #93 | Exceptional 10.1% |
| Immigrants | Germany | 96.7 /100 | #94 | Exceptional 10.1% |