Immigrants from Europe vs Hmong Seniors Poverty Over the Age of 65
COMPARE
Immigrants from Europe
Hmong
Seniors Poverty Over the Age of 65
Seniors Poverty Over the Age of 65 Comparison
Immigrants from Europe
Hmong
10.5%
SENIORS POVERTY OVER THE AGE OF 65
83.3/ 100
METRIC RATING
141st/ 347
METRIC RANK
10.4%
SENIORS POVERTY OVER THE AGE OF 65
90.0/ 100
METRIC RATING
123rd/ 347
METRIC RANK
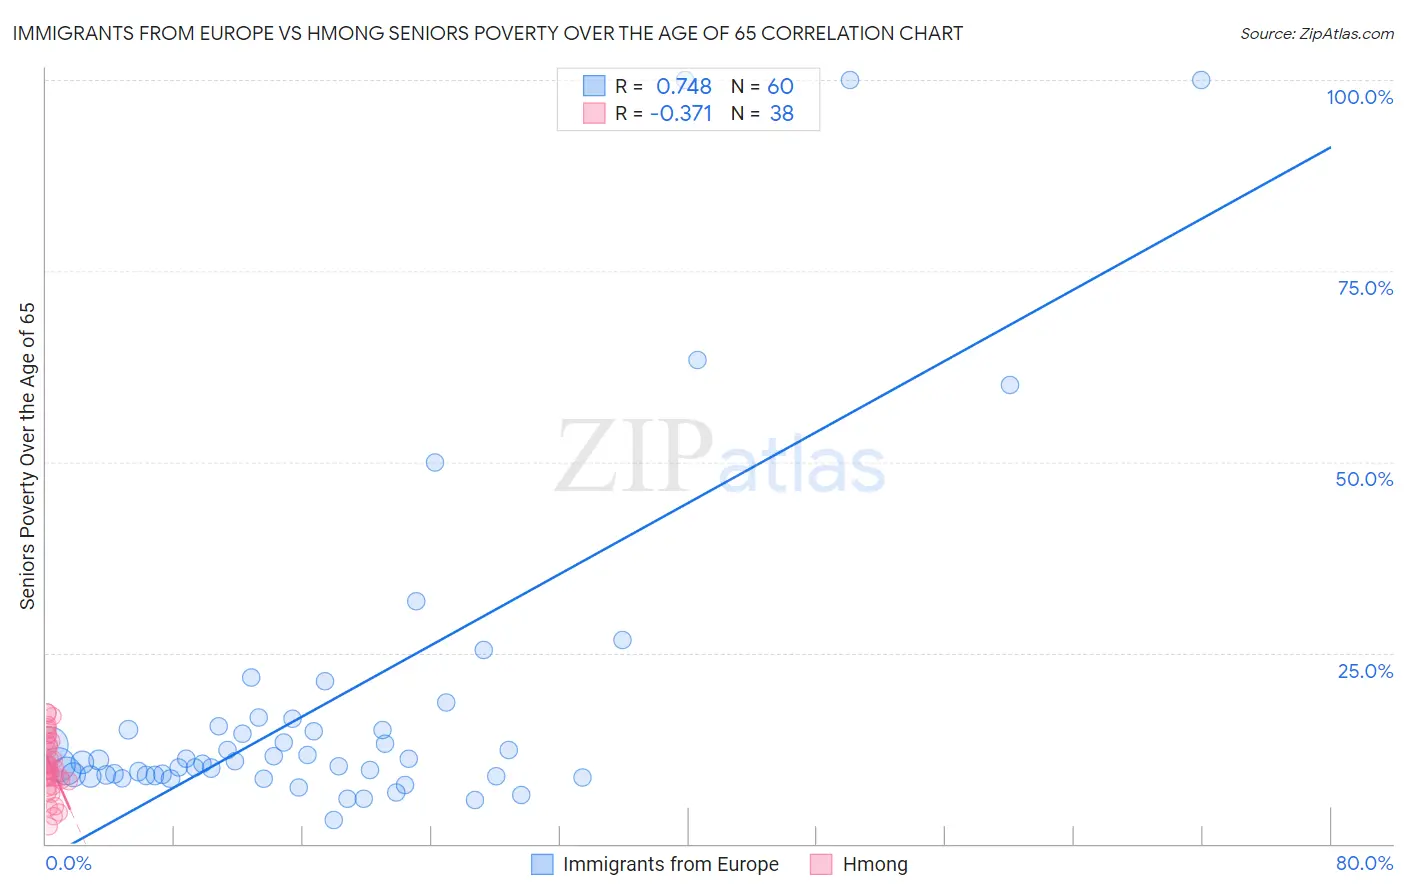
Immigrants from Europe vs Hmong Seniors Poverty Over the Age of 65 Correlation Chart
The statistical analysis conducted on geographies consisting of 543,216,958 people shows a strong positive correlation between the proportion of Immigrants from Europe and poverty level among seniors over the age of 65 in the United States with a correlation coefficient (R) of 0.748 and weighted average of 10.5%. Similarly, the statistical analysis conducted on geographies consisting of 24,669,739 people shows a mild negative correlation between the proportion of Hmong and poverty level among seniors over the age of 65 in the United States with a correlation coefficient (R) of -0.371 and weighted average of 10.4%, a difference of 1.4%.
Seniors Poverty Over the Age of 65 Correlation Summary
| Measurement | Immigrants from Europe | Hmong |
| Minimum | 3.2% | 2.3% |
| Maximum | 100.0% | 17.3% |
| Range | 96.8% | 15.0% |
| Mean | 18.5% | 10.2% |
| Median | 10.7% | 9.7% |
| Interquartile 25% (IQ1) | 8.9% | 8.2% |
| Interquartile 75% (IQ3) | 15.2% | 13.4% |
| Interquartile Range (IQR) | 6.2% | 5.2% |
| Standard Deviation (Sample) | 22.0% | 3.9% |
| Standard Deviation (Population) | 21.8% | 3.8% |
Demographics Similar to Immigrants from Europe and Hmong by Seniors Poverty Over the Age of 65
In terms of seniors poverty over the age of 65, the demographic groups most similar to Immigrants from Europe are Immigrants from Kenya (10.5%, a difference of 0.020%), Osage (10.6%, a difference of 0.070%), Portuguese (10.5%, a difference of 0.15%), Immigrants from Latvia (10.5%, a difference of 0.25%), and Immigrants from Australia (10.5%, a difference of 0.31%). Similarly, the demographic groups most similar to Hmong are Asian (10.4%, a difference of 0.030%), Immigrants from Philippines (10.4%, a difference of 0.17%), Immigrants from Moldova (10.4%, a difference of 0.18%), Immigrants from Hungary (10.4%, a difference of 0.23%), and Cambodian (10.4%, a difference of 0.23%).
| Demographics | Rating | Rank | Seniors Poverty Over the Age of 65 |
| Immigrants | Moldova | 90.7 /100 | #122 | Exceptional 10.4% |
| Hmong | 90.0 /100 | #123 | Exceptional 10.4% |
| Asians | 89.9 /100 | #124 | Excellent 10.4% |
| Immigrants | Philippines | 89.4 /100 | #125 | Excellent 10.4% |
| Immigrants | Hungary | 89.1 /100 | #126 | Excellent 10.4% |
| Cambodians | 89.1 /100 | #127 | Excellent 10.4% |
| Ottawa | 88.5 /100 | #128 | Excellent 10.4% |
| Immigrants | Iran | 88.4 /100 | #129 | Excellent 10.4% |
| Immigrants | Oceania | 88.4 /100 | #130 | Excellent 10.4% |
| Egyptians | 87.8 /100 | #131 | Excellent 10.5% |
| Immigrants | Turkey | 87.7 /100 | #132 | Excellent 10.5% |
| Guamanians/Chamorros | 87.5 /100 | #133 | Excellent 10.5% |
| Sierra Leoneans | 86.8 /100 | #134 | Excellent 10.5% |
| Immigrants | Norway | 86.5 /100 | #135 | Excellent 10.5% |
| Immigrants | Serbia | 86.4 /100 | #136 | Excellent 10.5% |
| Immigrants | Australia | 85.1 /100 | #137 | Excellent 10.5% |
| Immigrants | Latvia | 84.7 /100 | #138 | Excellent 10.5% |
| Portuguese | 84.1 /100 | #139 | Excellent 10.5% |
| Immigrants | Kenya | 83.4 /100 | #140 | Excellent 10.5% |
| Immigrants | Europe | 83.3 /100 | #141 | Excellent 10.5% |
| Osage | 82.8 /100 | #142 | Excellent 10.6% |