Immigrants from South America vs Guyanese 1st Grade
COMPARE
Immigrants from South America
Guyanese
1st Grade
1st Grade Comparison
Immigrants from South America
Guyanese
97.5%
1ST GRADE
0.4/ 100
METRIC RATING
263rd/ 347
METRIC RANK
96.9%
1ST GRADE
0.0/ 100
METRIC RATING
313th/ 347
METRIC RANK
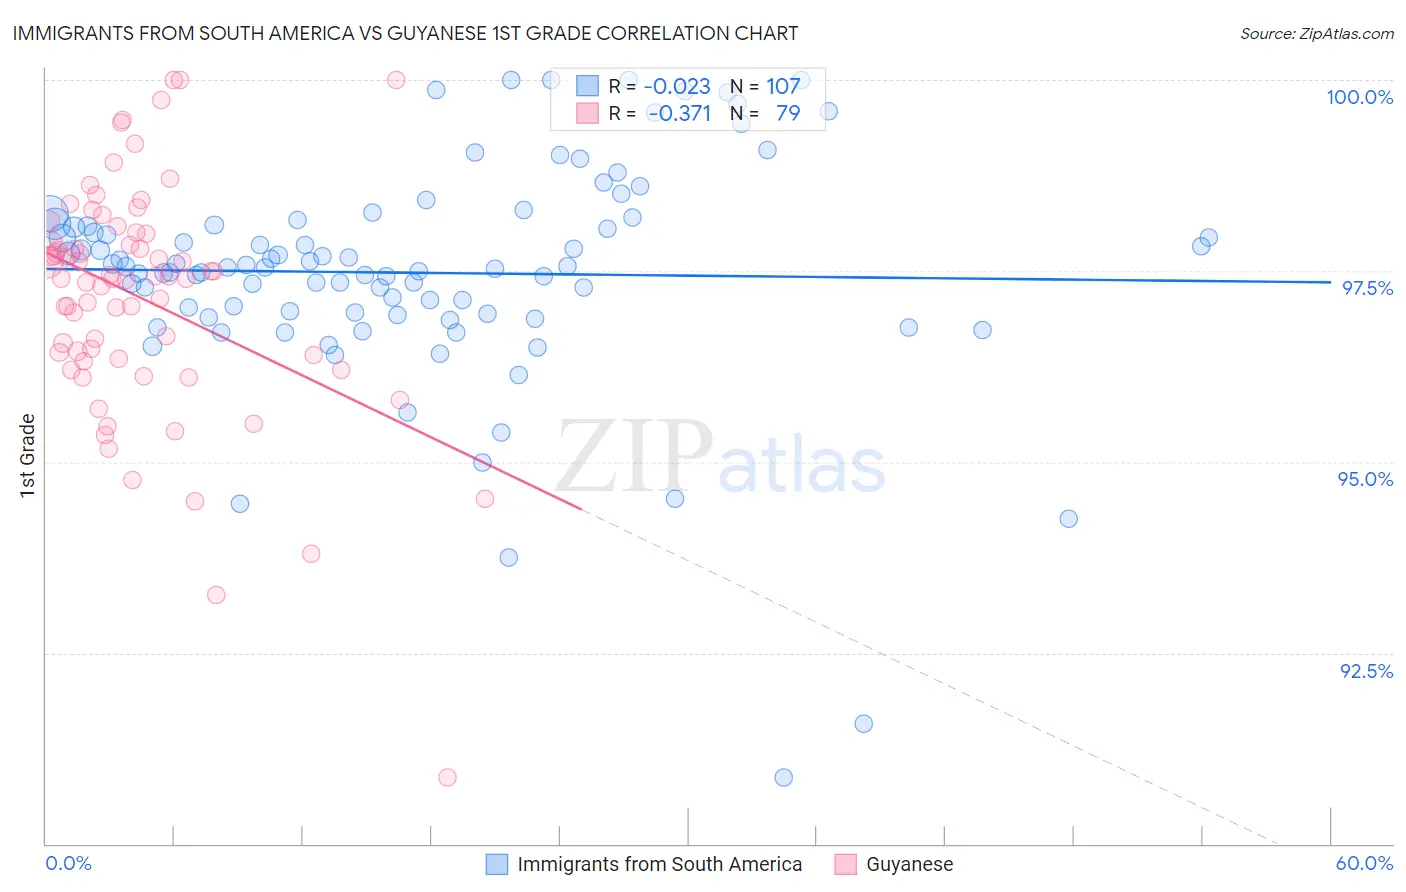
Immigrants from South America vs Guyanese 1st Grade Correlation Chart
The statistical analysis conducted on geographies consisting of 486,429,719 people shows no correlation between the proportion of Immigrants from South America and percentage of population with at least 1st grade education in the United States with a correlation coefficient (R) of -0.023 and weighted average of 97.5%. Similarly, the statistical analysis conducted on geographies consisting of 176,921,765 people shows a mild negative correlation between the proportion of Guyanese and percentage of population with at least 1st grade education in the United States with a correlation coefficient (R) of -0.371 and weighted average of 96.9%, a difference of 0.63%.
1st Grade Correlation Summary
| Measurement | Immigrants from South America | Guyanese |
| Minimum | 90.9% | 90.9% |
| Maximum | 100.0% | 100.0% |
| Range | 9.1% | 9.1% |
| Mean | 97.5% | 97.1% |
| Median | 97.6% | 97.4% |
| Interquartile 25% (IQ1) | 96.9% | 96.4% |
| Interquartile 75% (IQ3) | 98.1% | 98.0% |
| Interquartile Range (IQR) | 1.2% | 1.6% |
| Standard Deviation (Sample) | 1.5% | 1.5% |
| Standard Deviation (Population) | 1.5% | 1.5% |
Similar Demographics by 1st Grade
Demographics Similar to Immigrants from South America by 1st Grade
In terms of 1st grade, the demographic groups most similar to Immigrants from South America are Immigrants from Ethiopia (97.5%, a difference of 0.0%), Assyrian/Chaldean/Syriac (97.5%, a difference of 0.0%), Taiwanese (97.5%, a difference of 0.0%), Fijian (97.5%, a difference of 0.010%), and Armenian (97.5%, a difference of 0.010%).
| Demographics | Rating | Rank | 1st Grade |
| Jamaicans | 0.6 /100 | #256 | Tragic 97.5% |
| Yaqui | 0.6 /100 | #257 | Tragic 97.5% |
| Indians (Asian) | 0.6 /100 | #258 | Tragic 97.5% |
| Fijians | 0.5 /100 | #259 | Tragic 97.5% |
| Armenians | 0.5 /100 | #260 | Tragic 97.5% |
| Immigrants | Ethiopia | 0.4 /100 | #261 | Tragic 97.5% |
| Assyrians/Chaldeans/Syriacs | 0.4 /100 | #262 | Tragic 97.5% |
| Immigrants | South America | 0.4 /100 | #263 | Tragic 97.5% |
| Taiwanese | 0.4 /100 | #264 | Tragic 97.5% |
| Cubans | 0.3 /100 | #265 | Tragic 97.5% |
| Immigrants | Liberia | 0.3 /100 | #266 | Tragic 97.5% |
| Immigrants | Sierra Leone | 0.3 /100 | #267 | Tragic 97.5% |
| Immigrants | Nigeria | 0.3 /100 | #268 | Tragic 97.5% |
| West Indians | 0.3 /100 | #269 | Tragic 97.5% |
| Immigrants | Jamaica | 0.2 /100 | #270 | Tragic 97.5% |
Demographics Similar to Guyanese by 1st Grade
In terms of 1st grade, the demographic groups most similar to Guyanese are Sri Lankan (96.9%, a difference of 0.010%), Cape Verdean (96.9%, a difference of 0.010%), Honduran (96.9%, a difference of 0.020%), Immigrants from Haiti (96.9%, a difference of 0.030%), and Immigrants from the Azores (96.9%, a difference of 0.030%).
| Demographics | Rating | Rank | 1st Grade |
| Belizeans | 0.0 /100 | #306 | Tragic 96.9% |
| Immigrants | Somalia | 0.0 /100 | #307 | Tragic 96.9% |
| Hispanics or Latinos | 0.0 /100 | #308 | Tragic 96.9% |
| Immigrants | Haiti | 0.0 /100 | #309 | Tragic 96.9% |
| Immigrants | Azores | 0.0 /100 | #310 | Tragic 96.9% |
| Sri Lankans | 0.0 /100 | #311 | Tragic 96.9% |
| Cape Verdeans | 0.0 /100 | #312 | Tragic 96.9% |
| Guyanese | 0.0 /100 | #313 | Tragic 96.9% |
| Hondurans | 0.0 /100 | #314 | Tragic 96.9% |
| Immigrants | Belize | 0.0 /100 | #315 | Tragic 96.9% |
| Immigrants | Ecuador | 0.0 /100 | #316 | Tragic 96.9% |
| Immigrants | Nicaragua | 0.0 /100 | #317 | Tragic 96.9% |
| Immigrants | Laos | 0.0 /100 | #318 | Tragic 96.8% |
| Immigrants | Guyana | 0.0 /100 | #319 | Tragic 96.8% |
| Immigrants | Burma/Myanmar | 0.0 /100 | #320 | Tragic 96.8% |