Immigrants from Singapore vs Ute No Schooling Completed
COMPARE
Immigrants from Singapore
Ute
No Schooling Completed
No Schooling Completed Comparison
Immigrants from Singapore
Ute
1.8%
NO SCHOOLING COMPLETED
98.0/ 100
METRIC RATING
100th/ 347
METRIC RANK
2.3%
NO SCHOOLING COMPLETED
8.2/ 100
METRIC RATING
213th/ 347
METRIC RANK
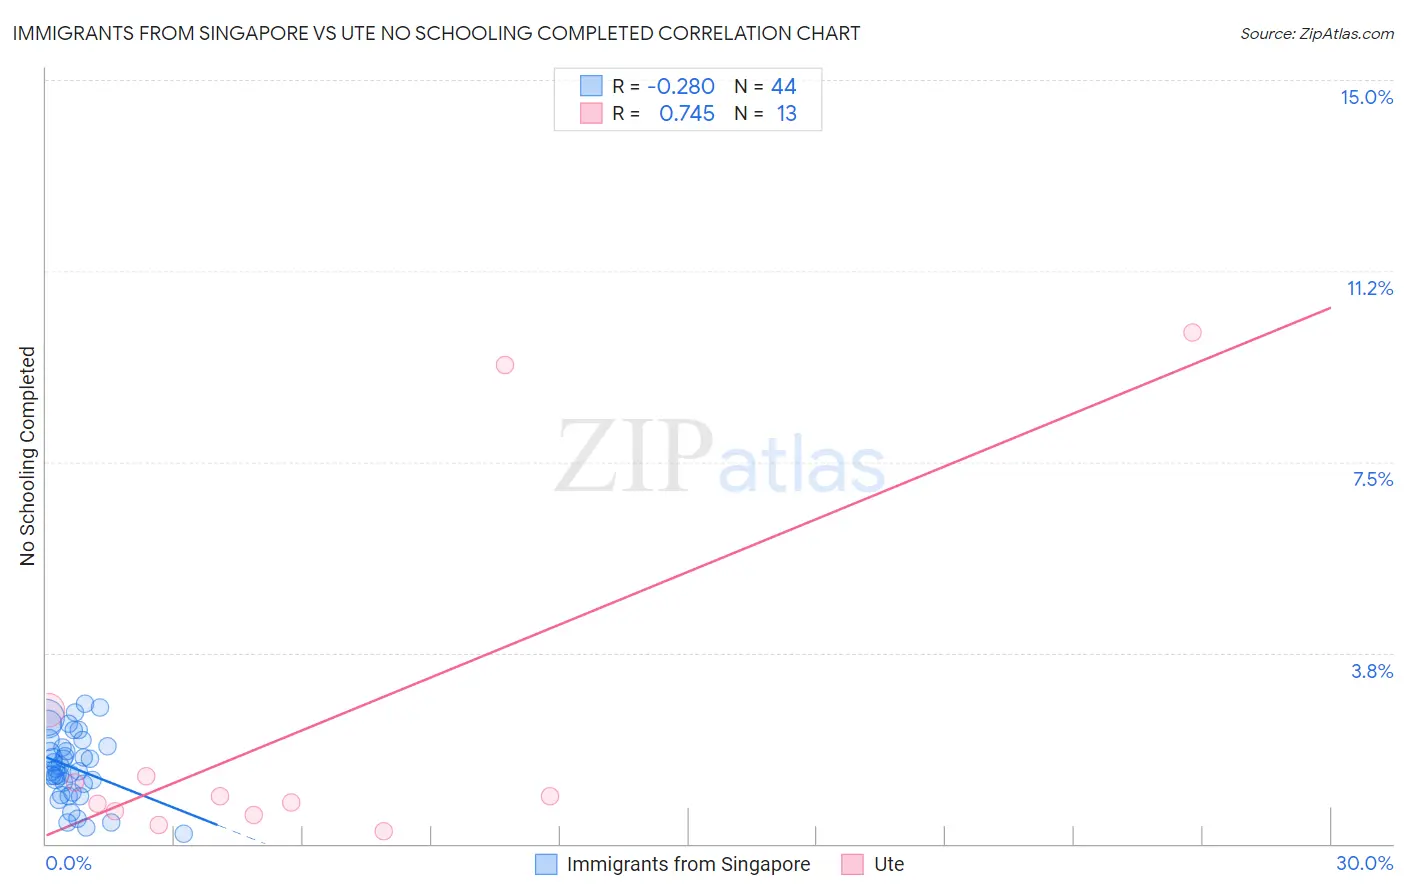
Immigrants from Singapore vs Ute No Schooling Completed Correlation Chart
The statistical analysis conducted on geographies consisting of 136,992,443 people shows a weak negative correlation between the proportion of Immigrants from Singapore and percentage of population with no schooling in the United States with a correlation coefficient (R) of -0.280 and weighted average of 1.8%. Similarly, the statistical analysis conducted on geographies consisting of 55,448,088 people shows a strong positive correlation between the proportion of Ute and percentage of population with no schooling in the United States with a correlation coefficient (R) of 0.745 and weighted average of 2.3%, a difference of 24.5%.
No Schooling Completed Correlation Summary
| Measurement | Immigrants from Singapore | Ute |
| Minimum | 0.21% | 0.24% |
| Maximum | 2.8% | 10.1% |
| Range | 2.6% | 9.8% |
| Mean | 1.5% | 2.3% |
| Median | 1.5% | 0.92% |
| Interquartile 25% (IQ1) | 1.1% | 0.61% |
| Interquartile 75% (IQ3) | 1.9% | 2.0% |
| Interquartile Range (IQR) | 0.82% | 1.4% |
| Standard Deviation (Sample) | 0.65% | 3.4% |
| Standard Deviation (Population) | 0.64% | 3.2% |
Similar Demographics by No Schooling Completed
Demographics Similar to Immigrants from Singapore by No Schooling Completed
In terms of no schooling completed, the demographic groups most similar to Immigrants from Singapore are Choctaw (1.8%, a difference of 0.20%), Immigrants from Czechoslovakia (1.8%, a difference of 0.30%), Immigrants from Switzerland (1.8%, a difference of 0.30%), Basque (1.8%, a difference of 0.35%), and Iranian (1.8%, a difference of 0.39%).
| Demographics | Rating | Rank | No Schooling Completed |
| Turks | 98.7 /100 | #93 | Exceptional 1.8% |
| Immigrants | Nonimmigrants | 98.5 /100 | #94 | Exceptional 1.8% |
| Puget Sound Salish | 98.5 /100 | #95 | Exceptional 1.8% |
| Bhutanese | 98.4 /100 | #96 | Exceptional 1.8% |
| Immigrants | Ireland | 98.4 /100 | #97 | Exceptional 1.8% |
| Iranians | 98.2 /100 | #98 | Exceptional 1.8% |
| Choctaw | 98.1 /100 | #99 | Exceptional 1.8% |
| Immigrants | Singapore | 98.0 /100 | #100 | Exceptional 1.8% |
| Immigrants | Czechoslovakia | 97.9 /100 | #101 | Exceptional 1.8% |
| Immigrants | Switzerland | 97.9 /100 | #102 | Exceptional 1.8% |
| Basques | 97.9 /100 | #103 | Exceptional 1.8% |
| Thais | 97.5 /100 | #104 | Exceptional 1.8% |
| German Russians | 97.5 /100 | #105 | Exceptional 1.8% |
| Immigrants | France | 97.3 /100 | #106 | Exceptional 1.8% |
| Yugoslavians | 97.2 /100 | #107 | Exceptional 1.8% |
Demographics Similar to Ute by No Schooling Completed
In terms of no schooling completed, the demographic groups most similar to Ute are Samoan (2.3%, a difference of 0.040%), Immigrants from Morocco (2.3%, a difference of 0.19%), Immigrants from Panama (2.3%, a difference of 0.20%), Immigrants from Zaire (2.3%, a difference of 0.47%), and Native/Alaskan (2.2%, a difference of 0.66%).
| Demographics | Rating | Rank | No Schooling Completed |
| Bahamians | 11.6 /100 | #206 | Poor 2.2% |
| South American Indians | 11.0 /100 | #207 | Poor 2.2% |
| Uruguayans | 11.0 /100 | #208 | Poor 2.2% |
| Immigrants | Oceania | 10.2 /100 | #209 | Poor 2.2% |
| Natives/Alaskans | 10.0 /100 | #210 | Tragic 2.2% |
| Immigrants | Panama | 8.8 /100 | #211 | Tragic 2.3% |
| Immigrants | Morocco | 8.7 /100 | #212 | Tragic 2.3% |
| Ute | 8.2 /100 | #213 | Tragic 2.3% |
| Samoans | 8.2 /100 | #214 | Tragic 2.3% |
| Immigrants | Zaire | 7.2 /100 | #215 | Tragic 2.3% |
| Tongans | 6.8 /100 | #216 | Tragic 2.3% |
| Immigrants | Syria | 6.6 /100 | #217 | Tragic 2.3% |
| Immigrants | Nepal | 6.4 /100 | #218 | Tragic 2.3% |
| Senegalese | 5.6 /100 | #219 | Tragic 2.3% |
| Immigrants | Costa Rica | 5.1 /100 | #220 | Tragic 2.3% |