Immigrants from Singapore vs Japanese Female Poverty Among 18-24 Year Olds
COMPARE
Immigrants from Singapore
Japanese
Female Poverty Among 18-24 Year Olds
Female Poverty Among 18-24 Year Olds Comparison
Immigrants from Singapore
Japanese
20.9%
FEMALE POVERTY AMONG 18-24 YEAR OLDS
4.4/ 100
METRIC RATING
238th/ 347
METRIC RANK
18.8%
FEMALE POVERTY AMONG 18-24 YEAR OLDS
99.5/ 100
METRIC RATING
81st/ 347
METRIC RANK
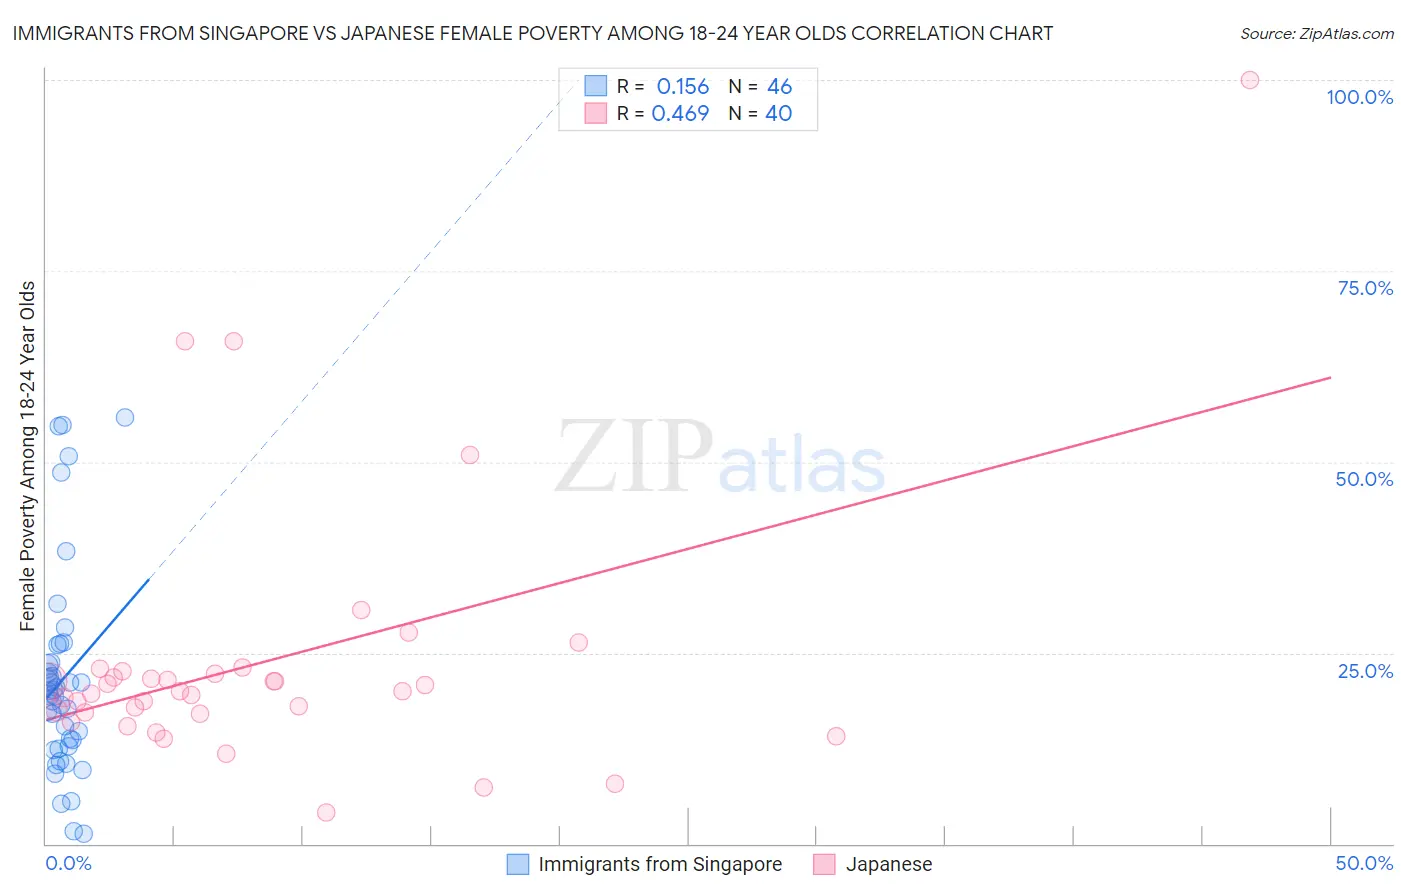
Immigrants from Singapore vs Japanese Female Poverty Among 18-24 Year Olds Correlation Chart
The statistical analysis conducted on geographies consisting of 136,205,115 people shows a poor positive correlation between the proportion of Immigrants from Singapore and poverty level among females between the ages 18 and 24 in the United States with a correlation coefficient (R) of 0.156 and weighted average of 20.9%. Similarly, the statistical analysis conducted on geographies consisting of 246,409,526 people shows a moderate positive correlation between the proportion of Japanese and poverty level among females between the ages 18 and 24 in the United States with a correlation coefficient (R) of 0.469 and weighted average of 18.8%, a difference of 10.9%.
Female Poverty Among 18-24 Year Olds Correlation Summary
| Measurement | Immigrants from Singapore | Japanese |
| Minimum | 1.3% | 4.1% |
| Maximum | 55.8% | 100.0% |
| Range | 54.6% | 95.9% |
| Mean | 21.4% | 23.9% |
| Median | 19.6% | 20.0% |
| Interquartile 25% (IQ1) | 12.8% | 17.1% |
| Interquartile 75% (IQ3) | 23.7% | 22.4% |
| Interquartile Range (IQR) | 10.9% | 5.3% |
| Standard Deviation (Sample) | 13.3% | 17.5% |
| Standard Deviation (Population) | 13.2% | 17.3% |
Similar Demographics by Female Poverty Among 18-24 Year Olds
Demographics Similar to Immigrants from Singapore by Female Poverty Among 18-24 Year Olds
In terms of female poverty among 18-24 year olds, the demographic groups most similar to Immigrants from Singapore are Immigrants from Guatemala (20.9%, a difference of 0.010%), Scottish (20.9%, a difference of 0.040%), Luxembourger (20.9%, a difference of 0.040%), Immigrants from Eritrea (20.9%, a difference of 0.050%), and Israeli (20.9%, a difference of 0.060%).
| Demographics | Rating | Rank | Female Poverty Among 18-24 Year Olds |
| Immigrants | St. Vincent and the Grenadines | 6.0 /100 | #231 | Tragic 20.8% |
| Finns | 6.0 /100 | #232 | Tragic 20.8% |
| Immigrants | Denmark | 5.8 /100 | #233 | Tragic 20.8% |
| Welsh | 5.4 /100 | #234 | Tragic 20.8% |
| Immigrants | Uganda | 5.1 /100 | #235 | Tragic 20.8% |
| Okinawans | 4.9 /100 | #236 | Tragic 20.8% |
| Scottish | 4.5 /100 | #237 | Tragic 20.9% |
| Immigrants | Singapore | 4.4 /100 | #238 | Tragic 20.9% |
| Immigrants | Guatemala | 4.3 /100 | #239 | Tragic 20.9% |
| Luxembourgers | 4.2 /100 | #240 | Tragic 20.9% |
| Immigrants | Eritrea | 4.2 /100 | #241 | Tragic 20.9% |
| Israelis | 4.1 /100 | #242 | Tragic 20.9% |
| Marshallese | 3.4 /100 | #243 | Tragic 20.9% |
| Immigrants | Thailand | 3.4 /100 | #244 | Tragic 20.9% |
| Aleuts | 3.3 /100 | #245 | Tragic 20.9% |
Demographics Similar to Japanese by Female Poverty Among 18-24 Year Olds
In terms of female poverty among 18-24 year olds, the demographic groups most similar to Japanese are Palestinian (18.8%, a difference of 0.0%), Immigrants from Europe (18.8%, a difference of 0.080%), Uruguayan (18.8%, a difference of 0.080%), Costa Rican (18.8%, a difference of 0.090%), and Immigrants from Uruguay (18.8%, a difference of 0.11%).
| Demographics | Rating | Rank | Female Poverty Among 18-24 Year Olds |
| Hawaiians | 99.6 /100 | #74 | Exceptional 18.7% |
| Poles | 99.6 /100 | #75 | Exceptional 18.8% |
| Immigrants | Cambodia | 99.5 /100 | #76 | Exceptional 18.8% |
| Costa Ricans | 99.5 /100 | #77 | Exceptional 18.8% |
| Immigrants | Europe | 99.5 /100 | #78 | Exceptional 18.8% |
| Uruguayans | 99.5 /100 | #79 | Exceptional 18.8% |
| Palestinians | 99.5 /100 | #80 | Exceptional 18.8% |
| Japanese | 99.5 /100 | #81 | Exceptional 18.8% |
| Immigrants | Uruguay | 99.4 /100 | #82 | Exceptional 18.8% |
| Immigrants | Indonesia | 99.4 /100 | #83 | Exceptional 18.9% |
| Burmese | 99.2 /100 | #84 | Exceptional 18.9% |
| Immigrants | Armenia | 99.2 /100 | #85 | Exceptional 18.9% |
| Immigrants | Iraq | 99.2 /100 | #86 | Exceptional 18.9% |
| Immigrants | Jamaica | 99.2 /100 | #87 | Exceptional 18.9% |
| Croatians | 99.1 /100 | #88 | Exceptional 19.0% |