Immigrants from Senegal vs Immigrants from Liberia Single Mother Poverty
COMPARE
Immigrants from Senegal
Immigrants from Liberia
Single Mother Poverty
Single Mother Poverty Comparison
Immigrants from Senegal
Immigrants from Liberia
31.5%
SINGLE MOTHER POVERTY
0.1/ 100
METRIC RATING
268th/ 347
METRIC RANK
30.1%
SINGLE MOTHER POVERTY
5.9/ 100
METRIC RATING
227th/ 347
METRIC RANK
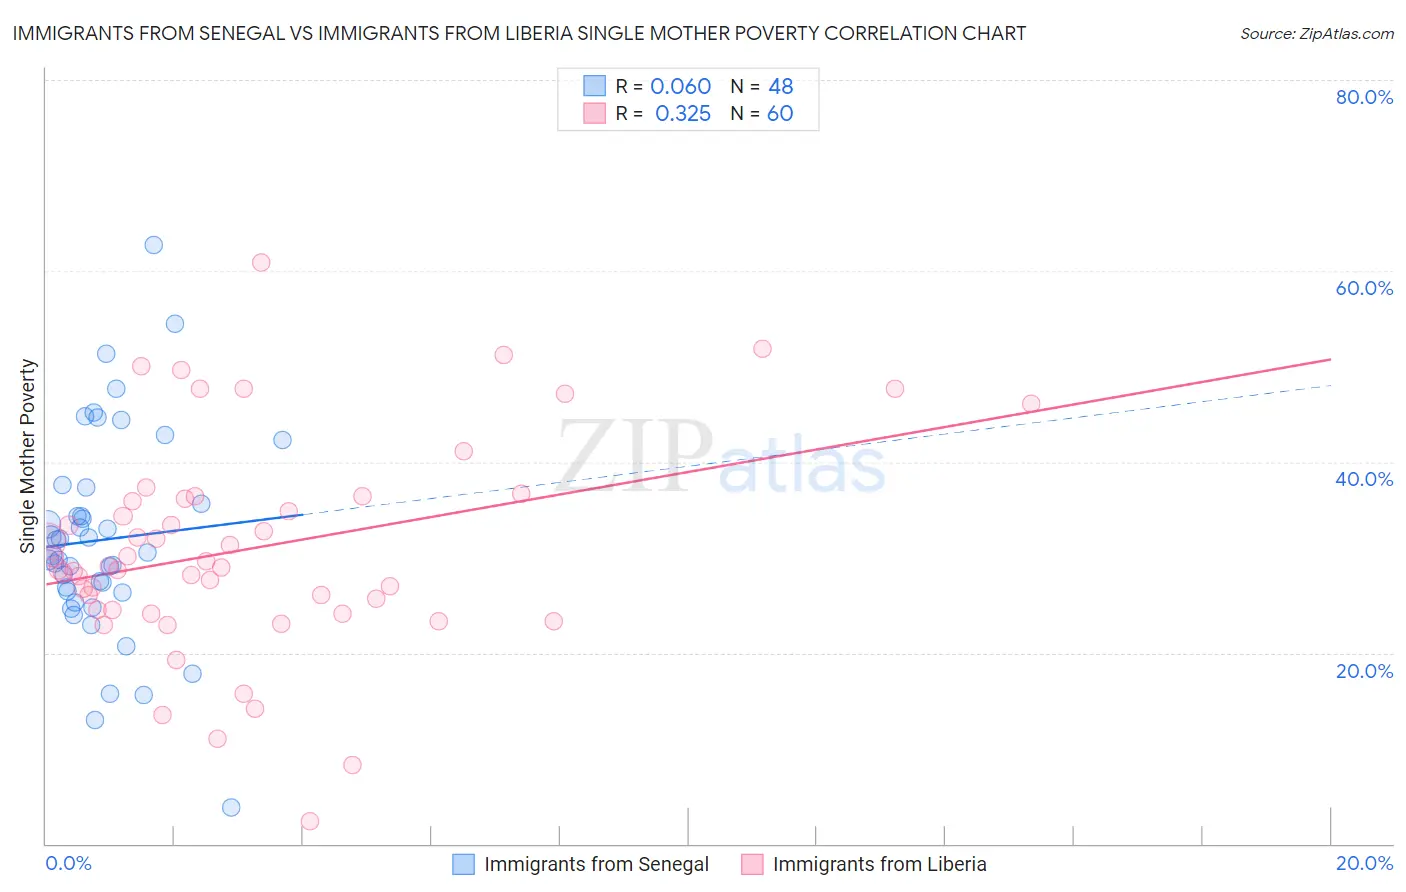
Immigrants from Senegal vs Immigrants from Liberia Single Mother Poverty Correlation Chart
The statistical analysis conducted on geographies consisting of 89,735,175 people shows a slight positive correlation between the proportion of Immigrants from Senegal and poverty level among single mothers in the United States with a correlation coefficient (R) of 0.060 and weighted average of 31.5%. Similarly, the statistical analysis conducted on geographies consisting of 134,572,167 people shows a mild positive correlation between the proportion of Immigrants from Liberia and poverty level among single mothers in the United States with a correlation coefficient (R) of 0.325 and weighted average of 30.1%, a difference of 4.4%.
Single Mother Poverty Correlation Summary
| Measurement | Immigrants from Senegal | Immigrants from Liberia |
| Minimum | 3.8% | 2.4% |
| Maximum | 62.7% | 60.9% |
| Range | 58.9% | 58.5% |
| Mean | 31.8% | 30.9% |
| Median | 30.4% | 29.0% |
| Interquartile 25% (IQ1) | 26.3% | 24.5% |
| Interquartile 75% (IQ3) | 36.4% | 36.2% |
| Interquartile Range (IQR) | 10.1% | 11.7% |
| Standard Deviation (Sample) | 10.9% | 11.3% |
| Standard Deviation (Population) | 10.8% | 11.2% |
Similar Demographics by Single Mother Poverty
Demographics Similar to Immigrants from Senegal by Single Mother Poverty
In terms of single mother poverty, the demographic groups most similar to Immigrants from Senegal are Scotch-Irish (31.5%, a difference of 0.040%), British West Indian (31.5%, a difference of 0.090%), Immigrants from Belize (31.4%, a difference of 0.18%), Subsaharan African (31.4%, a difference of 0.33%), and Immigrants from Cabo Verde (31.6%, a difference of 0.33%).
| Demographics | Rating | Rank | Single Mother Poverty |
| Immigrants | El Salvador | 0.3 /100 | #261 | Tragic 31.2% |
| Hmong | 0.3 /100 | #262 | Tragic 31.2% |
| Bahamians | 0.2 /100 | #263 | Tragic 31.3% |
| Immigrants | Ecuador | 0.2 /100 | #264 | Tragic 31.3% |
| German Russians | 0.2 /100 | #265 | Tragic 31.3% |
| Sub-Saharan Africans | 0.2 /100 | #266 | Tragic 31.4% |
| Immigrants | Belize | 0.2 /100 | #267 | Tragic 31.4% |
| Immigrants | Senegal | 0.1 /100 | #268 | Tragic 31.5% |
| Scotch-Irish | 0.1 /100 | #269 | Tragic 31.5% |
| British West Indians | 0.1 /100 | #270 | Tragic 31.5% |
| Immigrants | Cabo Verde | 0.1 /100 | #271 | Tragic 31.6% |
| Immigrants | Micronesia | 0.1 /100 | #272 | Tragic 31.6% |
| Fijians | 0.1 /100 | #273 | Tragic 31.6% |
| Bangladeshis | 0.1 /100 | #274 | Tragic 31.7% |
| Central Americans | 0.1 /100 | #275 | Tragic 31.8% |
Demographics Similar to Immigrants from Liberia by Single Mother Poverty
In terms of single mother poverty, the demographic groups most similar to Immigrants from Liberia are Scottish (30.1%, a difference of 0.030%), Spanish (30.1%, a difference of 0.090%), Spaniard (30.2%, a difference of 0.11%), Immigrants from Sudan (30.1%, a difference of 0.12%), and Immigrants from Cuba (30.1%, a difference of 0.19%).
| Demographics | Rating | Rank | Single Mother Poverty |
| Germans | 8.8 /100 | #220 | Tragic 30.0% |
| Immigrants | Eritrea | 7.7 /100 | #221 | Tragic 30.0% |
| Sudanese | 7.6 /100 | #222 | Tragic 30.0% |
| Immigrants | Cuba | 6.9 /100 | #223 | Tragic 30.1% |
| Immigrants | Sudan | 6.5 /100 | #224 | Tragic 30.1% |
| Spanish | 6.3 /100 | #225 | Tragic 30.1% |
| Scottish | 6.0 /100 | #226 | Tragic 30.1% |
| Immigrants | Liberia | 5.9 /100 | #227 | Tragic 30.1% |
| Spaniards | 5.4 /100 | #228 | Tragic 30.2% |
| Immigrants | Barbados | 5.0 /100 | #229 | Tragic 30.2% |
| English | 4.8 /100 | #230 | Tragic 30.2% |
| Dutch | 4.3 /100 | #231 | Tragic 30.2% |
| Alaskan Athabascans | 4.1 /100 | #232 | Tragic 30.3% |
| Immigrants | Middle Africa | 3.5 /100 | #233 | Tragic 30.3% |
| Immigrants | Nicaragua | 3.5 /100 | #234 | Tragic 30.3% |