Immigrants from Scotland vs Immigrants from Europe Seniors Poverty Over the Age of 65
COMPARE
Immigrants from Scotland
Immigrants from Europe
Seniors Poverty Over the Age of 65
Seniors Poverty Over the Age of 65 Comparison
Immigrants from Scotland
Immigrants from Europe
9.3%
SENIORS POVERTY OVER THE AGE OF 65
99.9/ 100
METRIC RATING
26th/ 347
METRIC RANK
10.5%
SENIORS POVERTY OVER THE AGE OF 65
83.3/ 100
METRIC RATING
141st/ 347
METRIC RANK
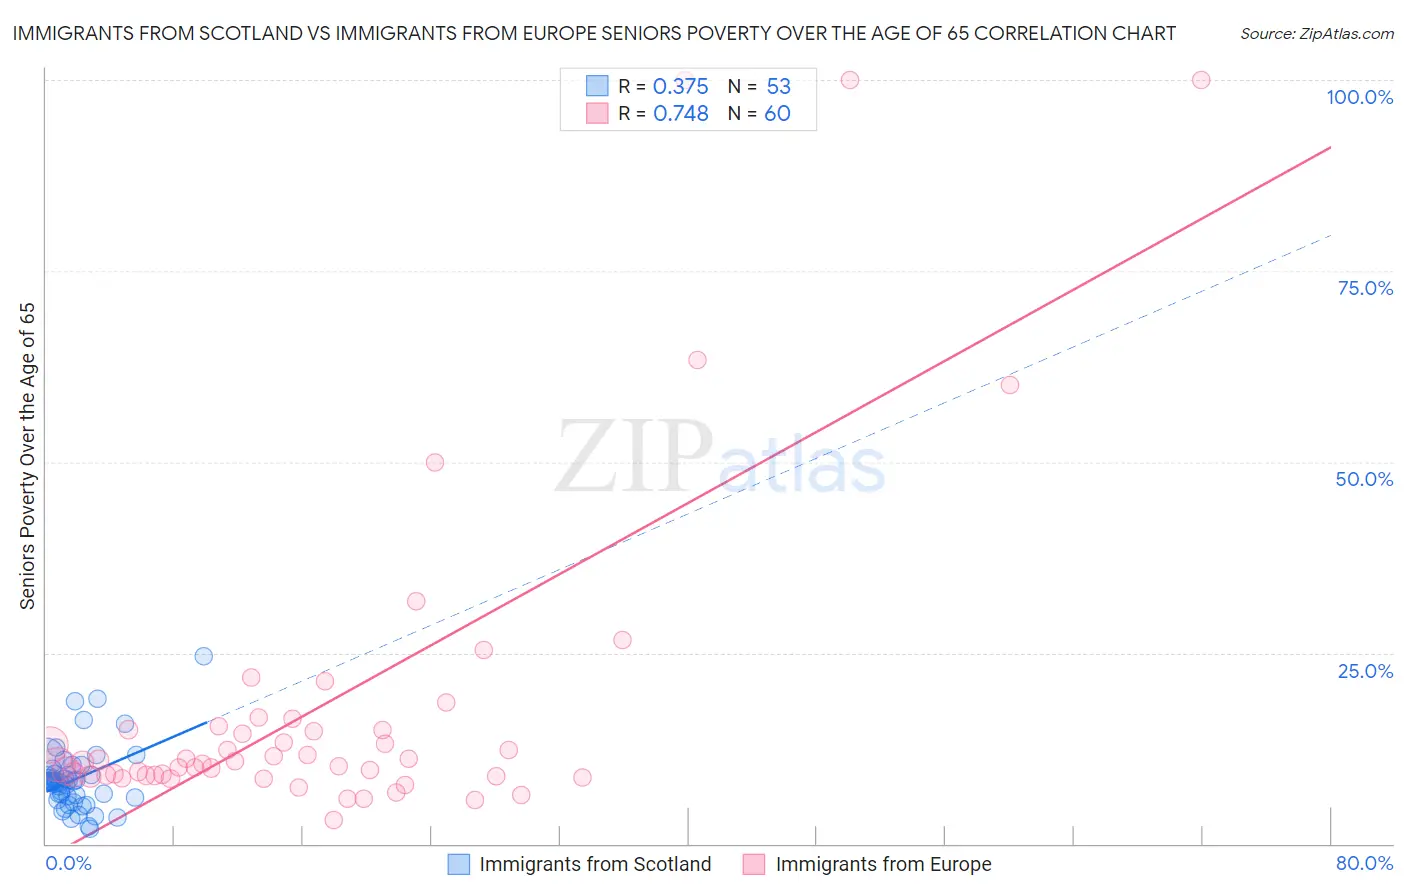
Immigrants from Scotland vs Immigrants from Europe Seniors Poverty Over the Age of 65 Correlation Chart
The statistical analysis conducted on geographies consisting of 196,224,492 people shows a mild positive correlation between the proportion of Immigrants from Scotland and poverty level among seniors over the age of 65 in the United States with a correlation coefficient (R) of 0.375 and weighted average of 9.3%. Similarly, the statistical analysis conducted on geographies consisting of 543,216,958 people shows a strong positive correlation between the proportion of Immigrants from Europe and poverty level among seniors over the age of 65 in the United States with a correlation coefficient (R) of 0.748 and weighted average of 10.5%, a difference of 13.5%.
Seniors Poverty Over the Age of 65 Correlation Summary
| Measurement | Immigrants from Scotland | Immigrants from Europe |
| Minimum | 2.0% | 3.2% |
| Maximum | 24.5% | 100.0% |
| Range | 22.5% | 96.8% |
| Mean | 8.4% | 18.5% |
| Median | 8.1% | 10.7% |
| Interquartile 25% (IQ1) | 5.8% | 8.9% |
| Interquartile 75% (IQ3) | 9.5% | 15.2% |
| Interquartile Range (IQR) | 3.7% | 6.2% |
| Standard Deviation (Sample) | 4.3% | 22.0% |
| Standard Deviation (Population) | 4.2% | 21.8% |
Similar Demographics by Seniors Poverty Over the Age of 65
Demographics Similar to Immigrants from Scotland by Seniors Poverty Over the Age of 65
In terms of seniors poverty over the age of 65, the demographic groups most similar to Immigrants from Scotland are Irish (9.3%, a difference of 0.030%), Italian (9.3%, a difference of 0.080%), Tongan (9.3%, a difference of 0.27%), Bulgarian (9.3%, a difference of 0.30%), and Welsh (9.3%, a difference of 0.38%).
| Demographics | Rating | Rank | Seniors Poverty Over the Age of 65 |
| Swiss | 99.9 /100 | #19 | Exceptional 9.2% |
| Thais | 99.9 /100 | #20 | Exceptional 9.2% |
| Luxembourgers | 99.9 /100 | #21 | Exceptional 9.2% |
| Slovenes | 99.9 /100 | #22 | Exceptional 9.3% |
| Welsh | 99.9 /100 | #23 | Exceptional 9.3% |
| Bulgarians | 99.9 /100 | #24 | Exceptional 9.3% |
| Irish | 99.9 /100 | #25 | Exceptional 9.3% |
| Immigrants | Scotland | 99.9 /100 | #26 | Exceptional 9.3% |
| Italians | 99.9 /100 | #27 | Exceptional 9.3% |
| Tongans | 99.9 /100 | #28 | Exceptional 9.3% |
| Bhutanese | 99.9 /100 | #29 | Exceptional 9.3% |
| Menominee | 99.8 /100 | #30 | Exceptional 9.4% |
| Finns | 99.8 /100 | #31 | Exceptional 9.4% |
| Northern Europeans | 99.8 /100 | #32 | Exceptional 9.4% |
| Native Hawaiians | 99.8 /100 | #33 | Exceptional 9.4% |
Demographics Similar to Immigrants from Europe by Seniors Poverty Over the Age of 65
In terms of seniors poverty over the age of 65, the demographic groups most similar to Immigrants from Europe are Immigrants from Kenya (10.5%, a difference of 0.020%), Osage (10.6%, a difference of 0.070%), Portuguese (10.5%, a difference of 0.15%), Immigrants from Latvia (10.5%, a difference of 0.25%), and Immigrants from Australia (10.5%, a difference of 0.31%).
| Demographics | Rating | Rank | Seniors Poverty Over the Age of 65 |
| Sierra Leoneans | 86.8 /100 | #134 | Excellent 10.5% |
| Immigrants | Norway | 86.5 /100 | #135 | Excellent 10.5% |
| Immigrants | Serbia | 86.4 /100 | #136 | Excellent 10.5% |
| Immigrants | Australia | 85.1 /100 | #137 | Excellent 10.5% |
| Immigrants | Latvia | 84.7 /100 | #138 | Excellent 10.5% |
| Portuguese | 84.1 /100 | #139 | Excellent 10.5% |
| Immigrants | Kenya | 83.4 /100 | #140 | Excellent 10.5% |
| Immigrants | Europe | 83.3 /100 | #141 | Excellent 10.5% |
| Osage | 82.8 /100 | #142 | Excellent 10.6% |
| Immigrants | Asia | 80.8 /100 | #143 | Excellent 10.6% |
| Iraqis | 80.7 /100 | #144 | Excellent 10.6% |
| Laotians | 79.9 /100 | #145 | Good 10.6% |
| Alaskan Athabascans | 79.1 /100 | #146 | Good 10.6% |
| Immigrants | Greece | 79.0 /100 | #147 | Good 10.6% |
| Americans | 78.1 /100 | #148 | Good 10.6% |