Immigrants from Scotland vs European Seniors Poverty Over the Age of 65
COMPARE
Immigrants from Scotland
European
Seniors Poverty Over the Age of 65
Seniors Poverty Over the Age of 65 Comparison
Immigrants from Scotland
Europeans
9.3%
SENIORS POVERTY OVER THE AGE OF 65
99.9/ 100
METRIC RATING
26th/ 347
METRIC RANK
9.2%
SENIORS POVERTY OVER THE AGE OF 65
99.9/ 100
METRIC RATING
16th/ 347
METRIC RANK
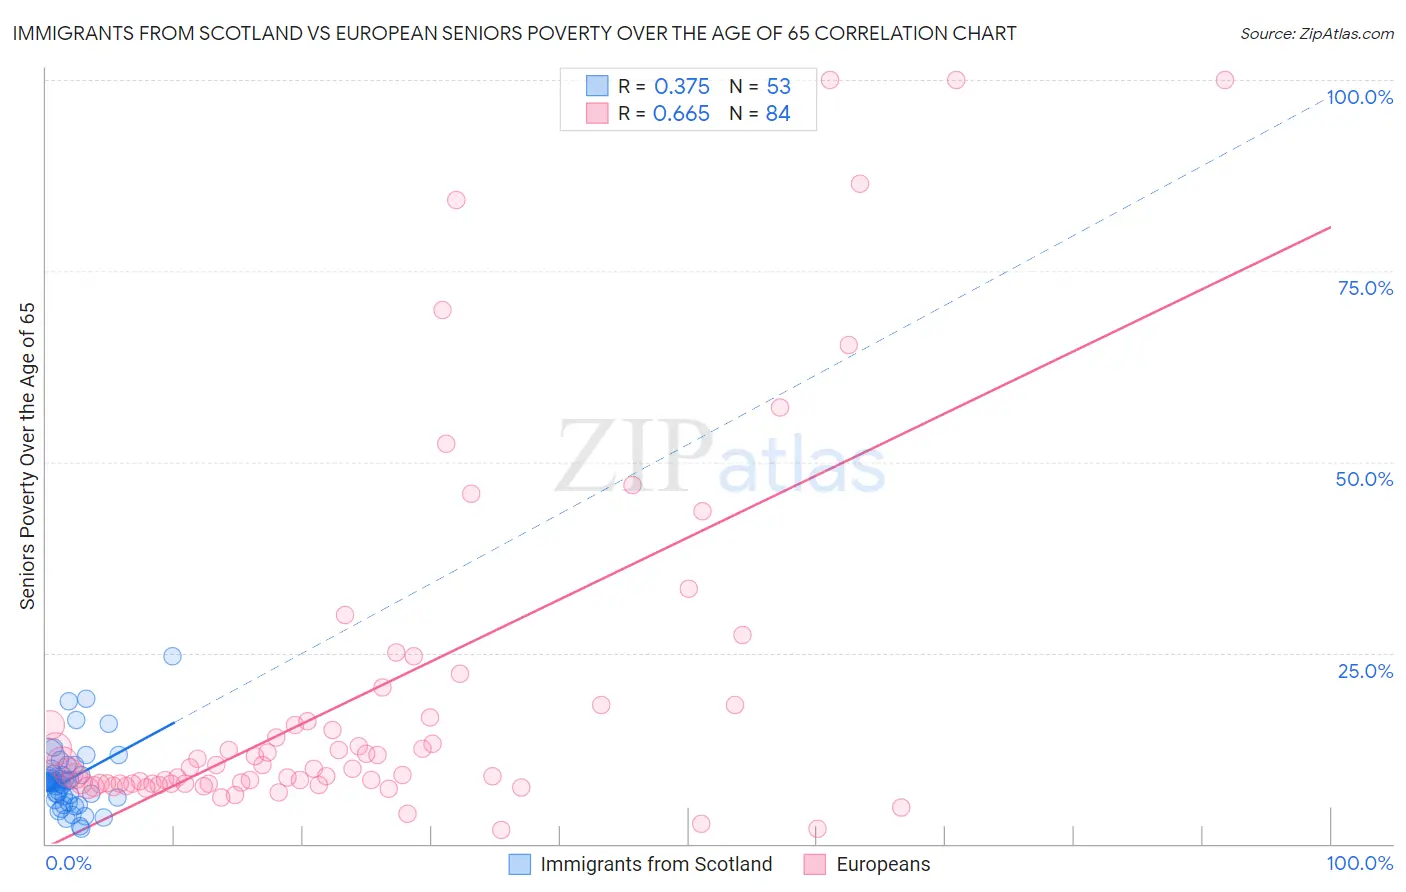
Immigrants from Scotland vs European Seniors Poverty Over the Age of 65 Correlation Chart
The statistical analysis conducted on geographies consisting of 196,224,492 people shows a mild positive correlation between the proportion of Immigrants from Scotland and poverty level among seniors over the age of 65 in the United States with a correlation coefficient (R) of 0.375 and weighted average of 9.3%. Similarly, the statistical analysis conducted on geographies consisting of 556,921,021 people shows a significant positive correlation between the proportion of Europeans and poverty level among seniors over the age of 65 in the United States with a correlation coefficient (R) of 0.665 and weighted average of 9.2%, a difference of 1.3%.
Seniors Poverty Over the Age of 65 Correlation Summary
| Measurement | Immigrants from Scotland | European |
| Minimum | 2.0% | 1.8% |
| Maximum | 24.5% | 100.0% |
| Range | 22.5% | 98.2% |
| Mean | 8.4% | 19.6% |
| Median | 8.1% | 9.9% |
| Interquartile 25% (IQ1) | 5.8% | 7.8% |
| Interquartile 75% (IQ3) | 9.5% | 17.4% |
| Interquartile Range (IQR) | 3.7% | 9.6% |
| Standard Deviation (Sample) | 4.3% | 23.3% |
| Standard Deviation (Population) | 4.2% | 23.2% |
Demographics Similar to Immigrants from Scotland and Europeans by Seniors Poverty Over the Age of 65
In terms of seniors poverty over the age of 65, the demographic groups most similar to Immigrants from Scotland are Irish (9.3%, a difference of 0.030%), Italian (9.3%, a difference of 0.080%), Tongan (9.3%, a difference of 0.27%), Bulgarian (9.3%, a difference of 0.30%), and Welsh (9.3%, a difference of 0.38%). Similarly, the demographic groups most similar to Europeans are Scottish (9.2%, a difference of 0.11%), Slovak (9.2%, a difference of 0.14%), Dutch (9.1%, a difference of 0.37%), Polish (9.1%, a difference of 0.43%), and Swiss (9.2%, a difference of 0.43%).
| Demographics | Rating | Rank | Seniors Poverty Over the Age of 65 |
| Maltese | 99.9 /100 | #11 | Exceptional 9.1% |
| Scandinavians | 99.9 /100 | #12 | Exceptional 9.1% |
| Croatians | 99.9 /100 | #13 | Exceptional 9.1% |
| Poles | 99.9 /100 | #14 | Exceptional 9.1% |
| Dutch | 99.9 /100 | #15 | Exceptional 9.1% |
| Europeans | 99.9 /100 | #16 | Exceptional 9.2% |
| Scottish | 99.9 /100 | #17 | Exceptional 9.2% |
| Slovaks | 99.9 /100 | #18 | Exceptional 9.2% |
| Swiss | 99.9 /100 | #19 | Exceptional 9.2% |
| Thais | 99.9 /100 | #20 | Exceptional 9.2% |
| Luxembourgers | 99.9 /100 | #21 | Exceptional 9.2% |
| Slovenes | 99.9 /100 | #22 | Exceptional 9.3% |
| Welsh | 99.9 /100 | #23 | Exceptional 9.3% |
| Bulgarians | 99.9 /100 | #24 | Exceptional 9.3% |
| Irish | 99.9 /100 | #25 | Exceptional 9.3% |
| Immigrants | Scotland | 99.9 /100 | #26 | Exceptional 9.3% |
| Italians | 99.9 /100 | #27 | Exceptional 9.3% |
| Tongans | 99.9 /100 | #28 | Exceptional 9.3% |
| Bhutanese | 99.9 /100 | #29 | Exceptional 9.3% |
| Menominee | 99.8 /100 | #30 | Exceptional 9.4% |
| Finns | 99.8 /100 | #31 | Exceptional 9.4% |