Immigrants from Scotland vs European In Labor Force | Age 45-54
COMPARE
Immigrants from Scotland
European
In Labor Force | Age 45-54
In Labor Force | Age 45-54 Comparison
Immigrants from Scotland
Europeans
83.0%
IN LABOR FORCE | AGE 45-54
77.8/ 100
METRIC RATING
142nd/ 347
METRIC RANK
82.6%
IN LABOR FORCE | AGE 45-54
32.6/ 100
METRIC RATING
184th/ 347
METRIC RANK
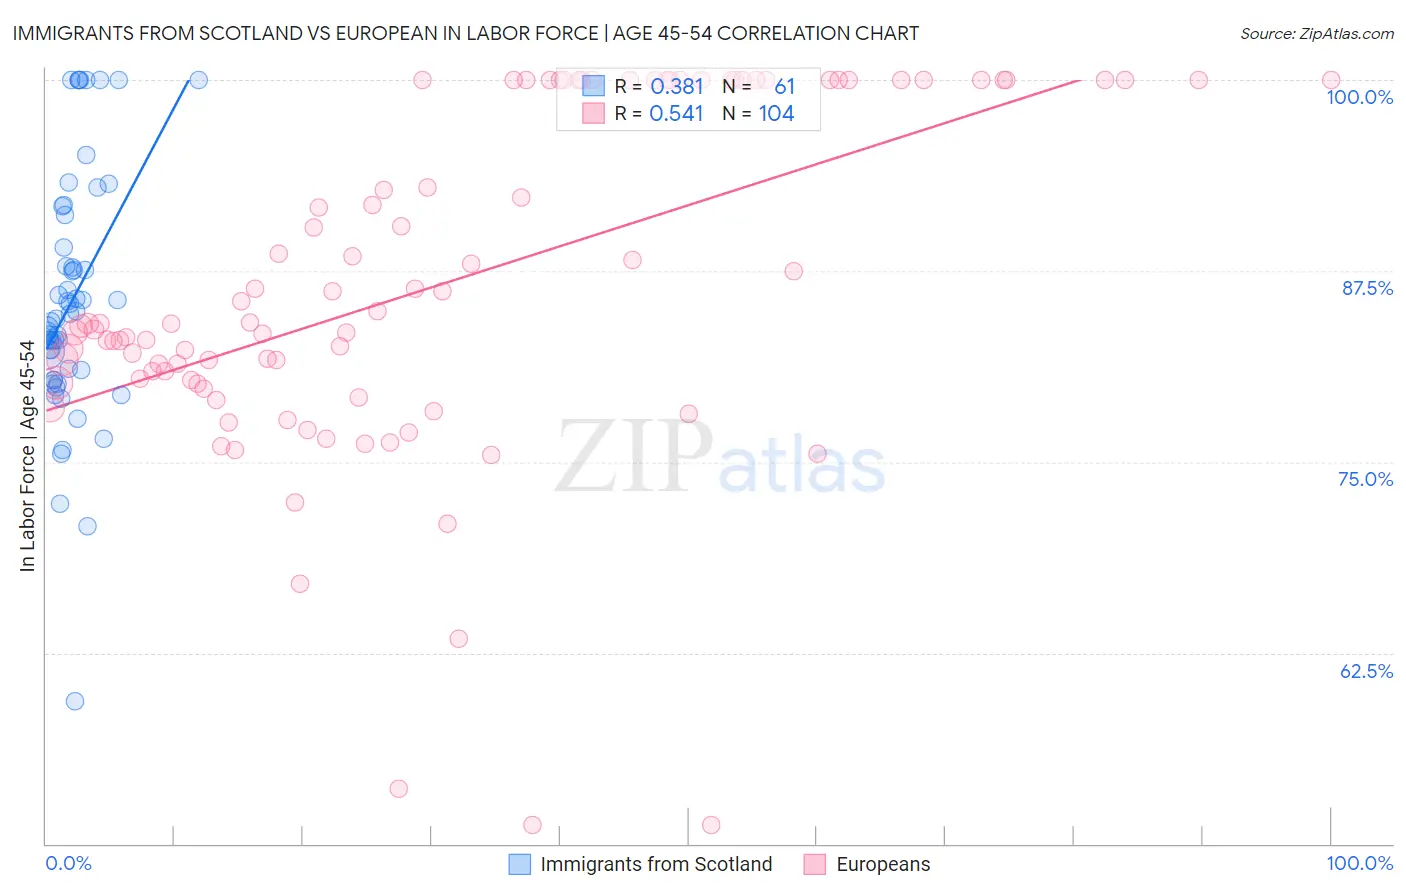
Immigrants from Scotland vs European In Labor Force | Age 45-54 Correlation Chart
The statistical analysis conducted on geographies consisting of 196,370,996 people shows a mild positive correlation between the proportion of Immigrants from Scotland and labor force participation rate among population between the ages 45 and 54 in the United States with a correlation coefficient (R) of 0.381 and weighted average of 83.0%. Similarly, the statistical analysis conducted on geographies consisting of 561,134,108 people shows a substantial positive correlation between the proportion of Europeans and labor force participation rate among population between the ages 45 and 54 in the United States with a correlation coefficient (R) of 0.541 and weighted average of 82.6%, a difference of 0.44%.
In Labor Force | Age 45-54 Correlation Summary
| Measurement | Immigrants from Scotland | European |
| Minimum | 59.3% | 51.2% |
| Maximum | 100.0% | 100.0% |
| Range | 40.7% | 48.8% |
| Mean | 85.6% | 86.7% |
| Median | 84.4% | 84.1% |
| Interquartile 25% (IQ1) | 80.7% | 80.3% |
| Interquartile 75% (IQ3) | 90.1% | 100.0% |
| Interquartile Range (IQR) | 9.4% | 19.7% |
| Standard Deviation (Sample) | 8.1% | 11.2% |
| Standard Deviation (Population) | 8.0% | 11.2% |
Similar Demographics by In Labor Force | Age 45-54
Demographics Similar to Immigrants from Scotland by In Labor Force | Age 45-54
In terms of in labor force | age 45-54, the demographic groups most similar to Immigrants from Scotland are Immigrants from Haiti (83.0%, a difference of 0.0%), Scandinavian (83.0%, a difference of 0.010%), Yugoslavian (83.0%, a difference of 0.010%), Okinawan (83.0%, a difference of 0.010%), and Soviet Union (83.0%, a difference of 0.010%).
| Demographics | Rating | Rank | In Labor Force | Age 45-54 |
| Austrians | 81.3 /100 | #135 | Excellent 83.0% |
| Immigrants | Kazakhstan | 81.0 /100 | #136 | Excellent 83.0% |
| Immigrants | Spain | 80.4 /100 | #137 | Excellent 83.0% |
| Ghanaians | 79.5 /100 | #138 | Good 83.0% |
| Scandinavians | 78.5 /100 | #139 | Good 83.0% |
| Yugoslavians | 78.3 /100 | #140 | Good 83.0% |
| Immigrants | Haiti | 77.9 /100 | #141 | Good 83.0% |
| Immigrants | Scotland | 77.8 /100 | #142 | Good 83.0% |
| Okinawans | 77.0 /100 | #143 | Good 83.0% |
| Soviet Union | 76.8 /100 | #144 | Good 83.0% |
| Romanians | 75.4 /100 | #145 | Good 83.0% |
| Immigrants | France | 75.3 /100 | #146 | Good 83.0% |
| Czechoslovakians | 74.8 /100 | #147 | Good 83.0% |
| Immigrants | Nigeria | 74.1 /100 | #148 | Good 83.0% |
| Immigrants | Sweden | 73.3 /100 | #149 | Good 82.9% |
Demographics Similar to Europeans by In Labor Force | Age 45-54
In terms of in labor force | age 45-54, the demographic groups most similar to Europeans are New Zealander (82.6%, a difference of 0.0%), Immigrants from England (82.6%, a difference of 0.0%), Immigrants from Hungary (82.7%, a difference of 0.040%), Irish (82.6%, a difference of 0.040%), and Hungarian (82.7%, a difference of 0.050%).
| Demographics | Rating | Rank | In Labor Force | Age 45-54 |
| Immigrants | Nicaragua | 44.6 /100 | #177 | Average 82.7% |
| Nigerians | 40.5 /100 | #178 | Average 82.7% |
| Immigrants | Switzerland | 39.4 /100 | #179 | Fair 82.7% |
| Hungarians | 38.0 /100 | #180 | Fair 82.7% |
| Israelis | 37.7 /100 | #181 | Fair 82.7% |
| Immigrants | Hungary | 37.1 /100 | #182 | Fair 82.7% |
| New Zealanders | 32.7 /100 | #183 | Fair 82.6% |
| Europeans | 32.6 /100 | #184 | Fair 82.6% |
| Immigrants | England | 32.2 /100 | #185 | Fair 82.6% |
| Irish | 29.2 /100 | #186 | Fair 82.6% |
| Immigrants | Costa Rica | 28.3 /100 | #187 | Fair 82.6% |
| South Africans | 28.0 /100 | #188 | Fair 82.6% |
| Syrians | 26.0 /100 | #189 | Fair 82.6% |
| British | 25.7 /100 | #190 | Fair 82.6% |
| Armenians | 23.2 /100 | #191 | Fair 82.5% |