Immigrants from Egypt vs European Seniors Poverty Over the Age of 65
COMPARE
Immigrants from Egypt
European
Seniors Poverty Over the Age of 65
Seniors Poverty Over the Age of 65 Comparison
Immigrants from Egypt
Europeans
10.6%
SENIORS POVERTY OVER THE AGE OF 65
76.5/ 100
METRIC RATING
152nd/ 347
METRIC RANK
9.2%
SENIORS POVERTY OVER THE AGE OF 65
99.9/ 100
METRIC RATING
16th/ 347
METRIC RANK
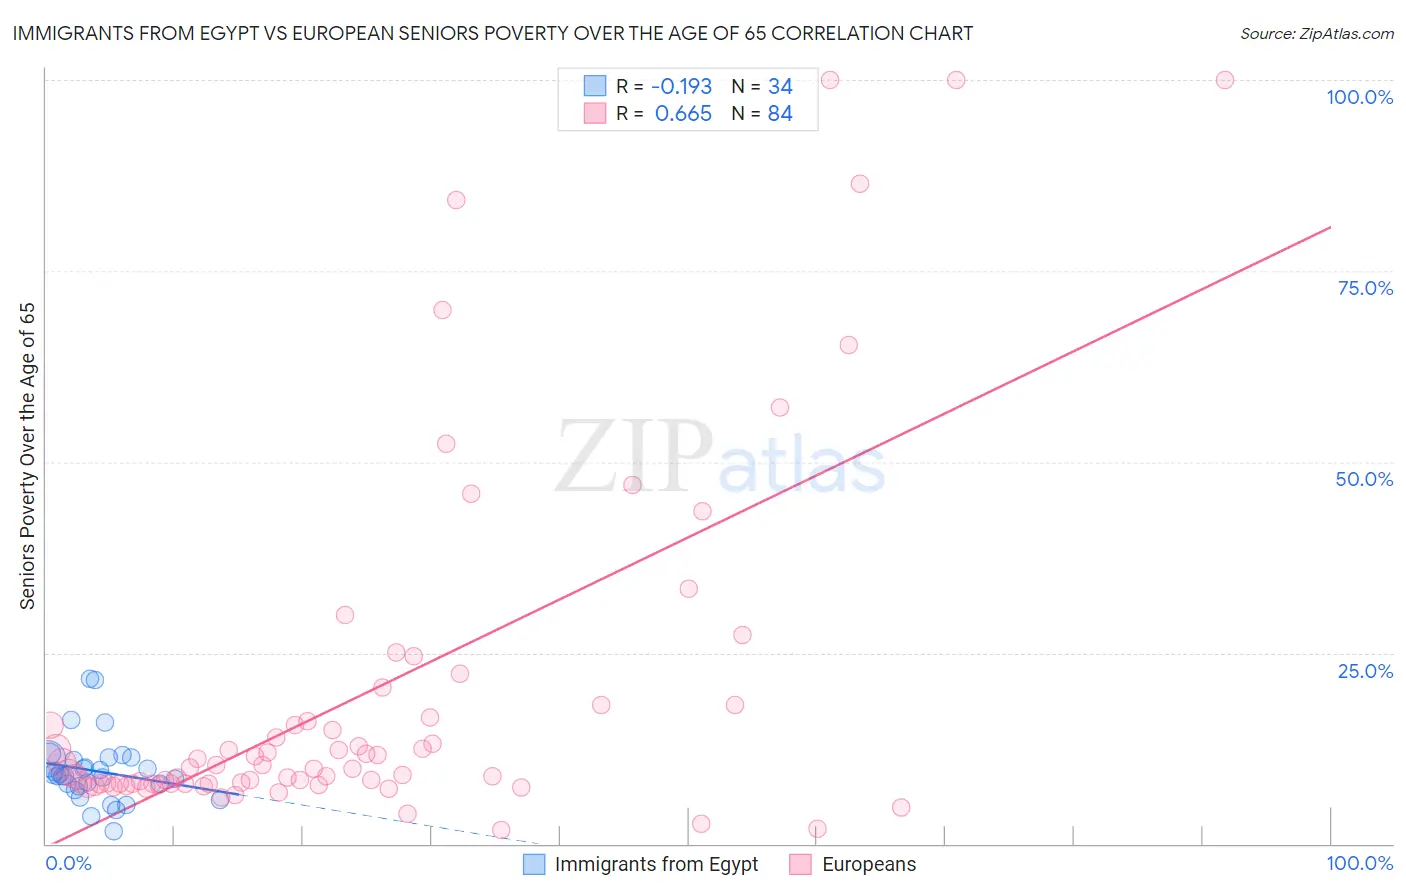
Immigrants from Egypt vs European Seniors Poverty Over the Age of 65 Correlation Chart
The statistical analysis conducted on geographies consisting of 245,049,036 people shows a poor negative correlation between the proportion of Immigrants from Egypt and poverty level among seniors over the age of 65 in the United States with a correlation coefficient (R) of -0.193 and weighted average of 10.6%. Similarly, the statistical analysis conducted on geographies consisting of 556,921,021 people shows a significant positive correlation between the proportion of Europeans and poverty level among seniors over the age of 65 in the United States with a correlation coefficient (R) of 0.665 and weighted average of 9.2%, a difference of 16.2%.
Seniors Poverty Over the Age of 65 Correlation Summary
| Measurement | Immigrants from Egypt | European |
| Minimum | 1.7% | 1.8% |
| Maximum | 21.6% | 100.0% |
| Range | 19.9% | 98.2% |
| Mean | 9.5% | 19.6% |
| Median | 9.0% | 9.9% |
| Interquartile 25% (IQ1) | 7.6% | 7.8% |
| Interquartile 75% (IQ3) | 11.1% | 17.4% |
| Interquartile Range (IQR) | 3.5% | 9.6% |
| Standard Deviation (Sample) | 4.3% | 23.3% |
| Standard Deviation (Population) | 4.2% | 23.2% |
Similar Demographics by Seniors Poverty Over the Age of 65
Demographics Similar to Immigrants from Egypt by Seniors Poverty Over the Age of 65
In terms of seniors poverty over the age of 65, the demographic groups most similar to Immigrants from Egypt are Spanish (10.6%, a difference of 0.040%), Immigrants from Switzerland (10.6%, a difference of 0.10%), Fijian (10.7%, a difference of 0.11%), Immigrants from Saudi Arabia (10.7%, a difference of 0.19%), and American (10.6%, a difference of 0.21%).
| Demographics | Rating | Rank | Seniors Poverty Over the Age of 65 |
| Laotians | 79.9 /100 | #145 | Good 10.6% |
| Alaskan Athabascans | 79.1 /100 | #146 | Good 10.6% |
| Immigrants | Greece | 79.0 /100 | #147 | Good 10.6% |
| Americans | 78.1 /100 | #148 | Good 10.6% |
| Immigrants | Cameroon | 78.1 /100 | #149 | Good 10.6% |
| Immigrants | Switzerland | 77.3 /100 | #150 | Good 10.6% |
| Spanish | 76.8 /100 | #151 | Good 10.6% |
| Immigrants | Egypt | 76.5 /100 | #152 | Good 10.6% |
| Fijians | 75.6 /100 | #153 | Good 10.7% |
| Immigrants | Saudi Arabia | 74.9 /100 | #154 | Good 10.7% |
| Chickasaw | 73.6 /100 | #155 | Good 10.7% |
| Ethiopians | 72.9 /100 | #156 | Good 10.7% |
| Immigrants | Ethiopia | 72.9 /100 | #157 | Good 10.7% |
| Immigrants | Sierra Leone | 71.7 /100 | #158 | Good 10.7% |
| Immigrants | Micronesia | 70.8 /100 | #159 | Good 10.7% |
Demographics Similar to Europeans by Seniors Poverty Over the Age of 65
In terms of seniors poverty over the age of 65, the demographic groups most similar to Europeans are Scottish (9.2%, a difference of 0.11%), Slovak (9.2%, a difference of 0.14%), Dutch (9.1%, a difference of 0.37%), Polish (9.1%, a difference of 0.43%), and Swiss (9.2%, a difference of 0.43%).
| Demographics | Rating | Rank | Seniors Poverty Over the Age of 65 |
| English | 100.0 /100 | #9 | Exceptional 9.1% |
| Lithuanians | 100.0 /100 | #10 | Exceptional 9.1% |
| Maltese | 99.9 /100 | #11 | Exceptional 9.1% |
| Scandinavians | 99.9 /100 | #12 | Exceptional 9.1% |
| Croatians | 99.9 /100 | #13 | Exceptional 9.1% |
| Poles | 99.9 /100 | #14 | Exceptional 9.1% |
| Dutch | 99.9 /100 | #15 | Exceptional 9.1% |
| Europeans | 99.9 /100 | #16 | Exceptional 9.2% |
| Scottish | 99.9 /100 | #17 | Exceptional 9.2% |
| Slovaks | 99.9 /100 | #18 | Exceptional 9.2% |
| Swiss | 99.9 /100 | #19 | Exceptional 9.2% |
| Thais | 99.9 /100 | #20 | Exceptional 9.2% |
| Luxembourgers | 99.9 /100 | #21 | Exceptional 9.2% |
| Slovenes | 99.9 /100 | #22 | Exceptional 9.3% |
| Welsh | 99.9 /100 | #23 | Exceptional 9.3% |