Immigrants from Saudi Arabia vs Immigrants from Hungary Child Poverty Among Boys Under 16
COMPARE
Immigrants from Saudi Arabia
Immigrants from Hungary
Child Poverty Among Boys Under 16
Child Poverty Among Boys Under 16 Comparison
Immigrants from Saudi Arabia
Immigrants from Hungary
16.4%
CHILD POVERTY AMONG BOYS UNDER 16
53.6/ 100
METRIC RATING
169th/ 347
METRIC RANK
15.7%
CHILD POVERTY AMONG BOYS UNDER 16
84.1/ 100
METRIC RATING
142nd/ 347
METRIC RANK
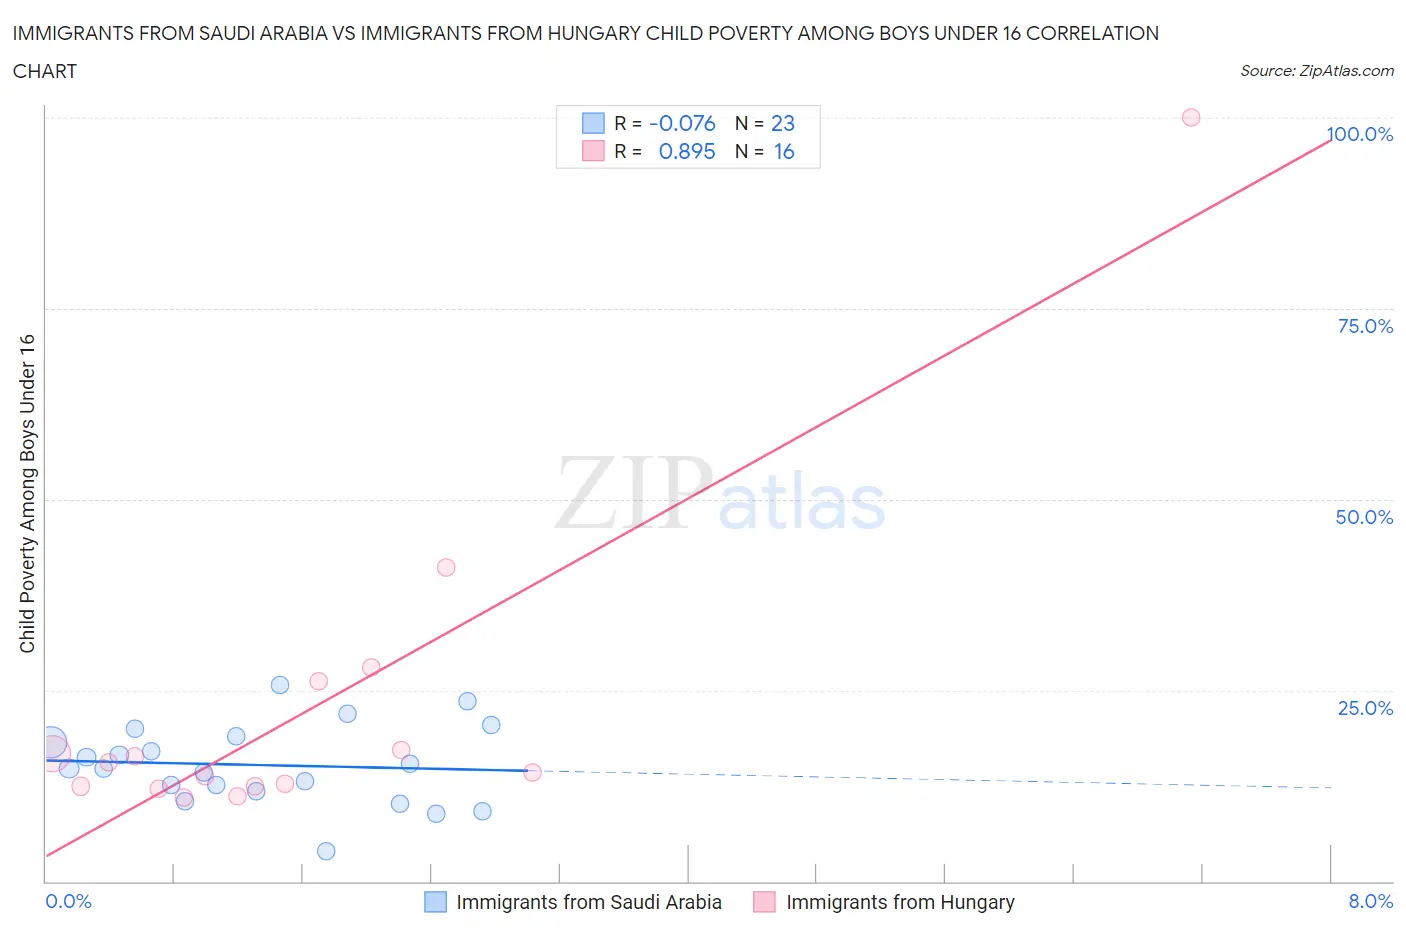
Immigrants from Saudi Arabia vs Immigrants from Hungary Child Poverty Among Boys Under 16 Correlation Chart
The statistical analysis conducted on geographies consisting of 163,294,532 people shows a slight negative correlation between the proportion of Immigrants from Saudi Arabia and poverty level among boys under the age of 16 in the United States with a correlation coefficient (R) of -0.076 and weighted average of 16.4%. Similarly, the statistical analysis conducted on geographies consisting of 193,561,492 people shows a very strong positive correlation between the proportion of Immigrants from Hungary and poverty level among boys under the age of 16 in the United States with a correlation coefficient (R) of 0.895 and weighted average of 15.7%, a difference of 4.4%.
Child Poverty Among Boys Under 16 Correlation Summary
| Measurement | Immigrants from Saudi Arabia | Immigrants from Hungary |
| Minimum | 3.9% | 10.9% |
| Maximum | 25.7% | 100.0% |
| Range | 21.8% | 89.1% |
| Mean | 15.2% | 22.5% |
| Median | 14.8% | 14.9% |
| Interquartile 25% (IQ1) | 11.8% | 12.4% |
| Interquartile 75% (IQ3) | 18.9% | 21.6% |
| Interquartile Range (IQR) | 7.1% | 9.2% |
| Standard Deviation (Sample) | 5.2% | 22.1% |
| Standard Deviation (Population) | 5.1% | 21.4% |
Similar Demographics by Child Poverty Among Boys Under 16
Demographics Similar to Immigrants from Saudi Arabia by Child Poverty Among Boys Under 16
In terms of child poverty among boys under 16, the demographic groups most similar to Immigrants from Saudi Arabia are South American (16.3%, a difference of 0.19%), Afghan (16.3%, a difference of 0.20%), Immigrants from Bosnia and Herzegovina (16.4%, a difference of 0.21%), Immigrants from Ethiopia (16.4%, a difference of 0.27%), and Immigrants from Colombia (16.4%, a difference of 0.32%).
| Demographics | Rating | Rank | Child Poverty Among Boys Under 16 |
| Guamanians/Chamorros | 69.6 /100 | #162 | Good 16.1% |
| Costa Ricans | 68.1 /100 | #163 | Good 16.1% |
| Immigrants | Albania | 67.9 /100 | #164 | Good 16.1% |
| Colombians | 65.2 /100 | #165 | Good 16.1% |
| Immigrants | Germany | 63.6 /100 | #166 | Good 16.2% |
| Afghans | 55.4 /100 | #167 | Average 16.3% |
| South Americans | 55.3 /100 | #168 | Average 16.3% |
| Immigrants | Saudi Arabia | 53.6 /100 | #169 | Average 16.4% |
| Immigrants | Bosnia and Herzegovina | 51.7 /100 | #170 | Average 16.4% |
| Immigrants | Ethiopia | 51.3 /100 | #171 | Average 16.4% |
| Immigrants | Colombia | 50.8 /100 | #172 | Average 16.4% |
| Tsimshian | 50.5 /100 | #173 | Average 16.4% |
| Uruguayans | 50.0 /100 | #174 | Average 16.4% |
| Immigrants | Syria | 49.0 /100 | #175 | Average 16.5% |
| Whites/Caucasians | 48.2 /100 | #176 | Average 16.5% |
Demographics Similar to Immigrants from Hungary by Child Poverty Among Boys Under 16
In terms of child poverty among boys under 16, the demographic groups most similar to Immigrants from Hungary are Slavic (15.7%, a difference of 0.090%), Immigrants from Fiji (15.7%, a difference of 0.11%), Immigrants from Peru (15.7%, a difference of 0.13%), Samoan (15.7%, a difference of 0.18%), and New Zealander (15.7%, a difference of 0.34%).
| Demographics | Rating | Rank | Child Poverty Among Boys Under 16 |
| Portuguese | 87.5 /100 | #135 | Excellent 15.5% |
| Icelanders | 87.5 /100 | #136 | Excellent 15.5% |
| Immigrants | Spain | 87.1 /100 | #137 | Excellent 15.6% |
| Immigrants | Southern Europe | 86.5 /100 | #138 | Excellent 15.6% |
| Albanians | 86.5 /100 | #139 | Excellent 15.6% |
| Immigrants | Kuwait | 85.6 /100 | #140 | Excellent 15.6% |
| Slavs | 84.5 /100 | #141 | Excellent 15.7% |
| Immigrants | Hungary | 84.1 /100 | #142 | Excellent 15.7% |
| Immigrants | Fiji | 83.6 /100 | #143 | Excellent 15.7% |
| Immigrants | Peru | 83.5 /100 | #144 | Excellent 15.7% |
| Samoans | 83.2 /100 | #145 | Excellent 15.7% |
| New Zealanders | 82.4 /100 | #146 | Excellent 15.7% |
| Venezuelans | 82.1 /100 | #147 | Excellent 15.7% |
| Brazilians | 81.0 /100 | #148 | Excellent 15.8% |
| Slovaks | 80.3 /100 | #149 | Excellent 15.8% |