Immigrants from Poland vs Sierra Leonean Child Poverty Under the Age of 5
COMPARE
Immigrants from Poland
Sierra Leonean
Child Poverty Under the Age of 5
Child Poverty Under the Age of 5 Comparison
Immigrants from Poland
Sierra Leoneans
15.1%
CHILD POVERTY UNDER THE AGE OF 5
99.1/ 100
METRIC RATING
61st/ 347
METRIC RANK
17.7%
CHILD POVERTY UNDER THE AGE OF 5
24.1/ 100
METRIC RATING
195th/ 347
METRIC RANK
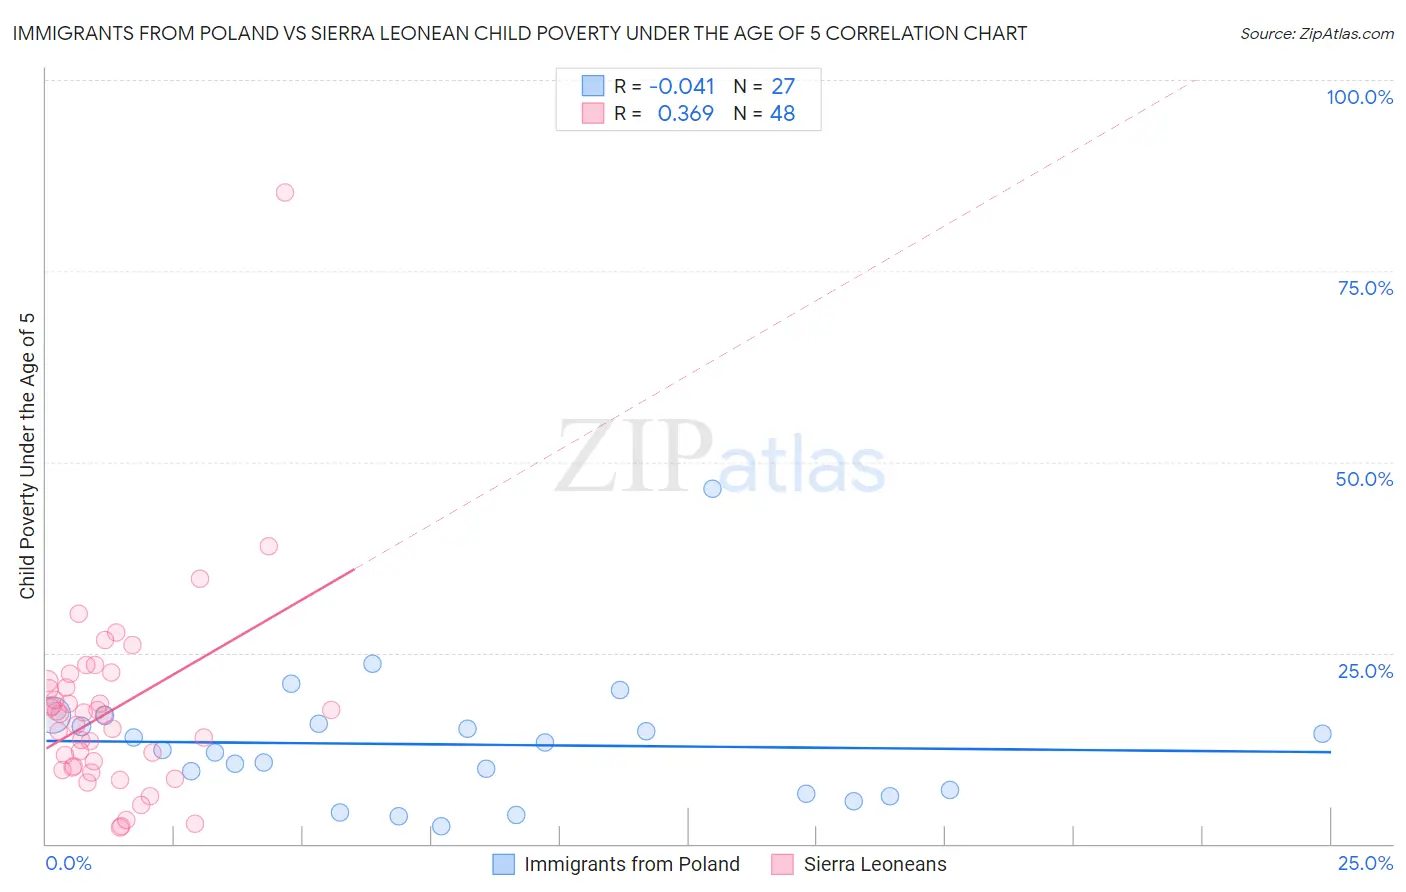
Immigrants from Poland vs Sierra Leonean Child Poverty Under the Age of 5 Correlation Chart
The statistical analysis conducted on geographies consisting of 290,713,862 people shows no correlation between the proportion of Immigrants from Poland and poverty level among children under the age of 5 in the United States with a correlation coefficient (R) of -0.041 and weighted average of 15.1%. Similarly, the statistical analysis conducted on geographies consisting of 82,787,385 people shows a mild positive correlation between the proportion of Sierra Leoneans and poverty level among children under the age of 5 in the United States with a correlation coefficient (R) of 0.369 and weighted average of 17.7%, a difference of 17.4%.
Child Poverty Under the Age of 5 Correlation Summary
| Measurement | Immigrants from Poland | Sierra Leonean |
| Minimum | 2.2% | 2.1% |
| Maximum | 46.5% | 85.3% |
| Range | 44.3% | 83.2% |
| Mean | 13.0% | 17.4% |
| Median | 12.3% | 16.9% |
| Interquartile 25% (IQ1) | 6.5% | 10.1% |
| Interquartile 75% (IQ3) | 15.7% | 20.8% |
| Interquartile Range (IQR) | 9.2% | 10.8% |
| Standard Deviation (Sample) | 8.7% | 12.9% |
| Standard Deviation (Population) | 8.6% | 12.7% |
Similar Demographics by Child Poverty Under the Age of 5
Demographics Similar to Immigrants from Poland by Child Poverty Under the Age of 5
In terms of child poverty under the age of 5, the demographic groups most similar to Immigrants from Poland are Immigrants from Eastern Europe (15.1%, a difference of 0.12%), Immigrants from Europe (15.1%, a difference of 0.25%), Immigrants from Romania (15.2%, a difference of 0.27%), Immigrants from Fiji (15.2%, a difference of 0.30%), and Immigrants from Scotland (15.2%, a difference of 0.42%).
| Demographics | Rating | Rank | Child Poverty Under the Age of 5 |
| Immigrants | Israel | 99.4 /100 | #54 | Exceptional 14.9% |
| Danes | 99.4 /100 | #55 | Exceptional 14.9% |
| Immigrants | Pakistan | 99.4 /100 | #56 | Exceptional 14.9% |
| Egyptians | 99.4 /100 | #57 | Exceptional 14.9% |
| Swedes | 99.4 /100 | #58 | Exceptional 15.0% |
| Paraguayans | 99.4 /100 | #59 | Exceptional 15.0% |
| Immigrants | Russia | 99.3 /100 | #60 | Exceptional 15.0% |
| Immigrants | Poland | 99.1 /100 | #61 | Exceptional 15.1% |
| Immigrants | Eastern Europe | 99.1 /100 | #62 | Exceptional 15.1% |
| Immigrants | Europe | 99.1 /100 | #63 | Exceptional 15.1% |
| Immigrants | Romania | 99.1 /100 | #64 | Exceptional 15.2% |
| Immigrants | Fiji | 99.0 /100 | #65 | Exceptional 15.2% |
| Immigrants | Scotland | 99.0 /100 | #66 | Exceptional 15.2% |
| Greeks | 99.0 /100 | #67 | Exceptional 15.2% |
| Zimbabweans | 99.0 /100 | #68 | Exceptional 15.2% |
Demographics Similar to Sierra Leoneans by Child Poverty Under the Age of 5
In terms of child poverty under the age of 5, the demographic groups most similar to Sierra Leoneans are French Canadian (17.7%, a difference of 0.070%), Immigrants from Uganda (17.7%, a difference of 0.12%), Immigrants from Portugal (17.8%, a difference of 0.27%), Immigrants from Uruguay (17.7%, a difference of 0.49%), and Immigrants from Afghanistan (17.7%, a difference of 0.50%).
| Demographics | Rating | Rank | Child Poverty Under the Age of 5 |
| Carpatho Rusyns | 33.6 /100 | #188 | Fair 17.5% |
| French | 33.6 /100 | #189 | Fair 17.5% |
| Slovaks | 29.2 /100 | #190 | Fair 17.6% |
| Immigrants | Afghanistan | 27.9 /100 | #191 | Fair 17.7% |
| Immigrants | Uruguay | 27.8 /100 | #192 | Fair 17.7% |
| Immigrants | Uganda | 25.0 /100 | #193 | Fair 17.7% |
| French Canadians | 24.6 /100 | #194 | Fair 17.7% |
| Sierra Leoneans | 24.1 /100 | #195 | Fair 17.7% |
| Immigrants | Portugal | 22.2 /100 | #196 | Fair 17.8% |
| Immigrants | Kenya | 20.0 /100 | #197 | Fair 17.9% |
| Celtics | 18.3 /100 | #198 | Poor 17.9% |
| Hungarians | 18.3 /100 | #199 | Poor 17.9% |
| Iraqis | 14.0 /100 | #200 | Poor 18.0% |
| Ugandans | 13.9 /100 | #201 | Poor 18.0% |
| Japanese | 13.8 /100 | #202 | Poor 18.1% |