Immigrants from Poland vs Immigrants from Philippines Child Poverty Under the Age of 5
COMPARE
Immigrants from Poland
Immigrants from Philippines
Child Poverty Under the Age of 5
Child Poverty Under the Age of 5 Comparison
Immigrants from Poland
Immigrants from Philippines
15.1%
CHILD POVERTY UNDER THE AGE OF 5
99.1/ 100
METRIC RATING
61st/ 347
METRIC RANK
14.7%
CHILD POVERTY UNDER THE AGE OF 5
99.7/ 100
METRIC RATING
44th/ 347
METRIC RANK
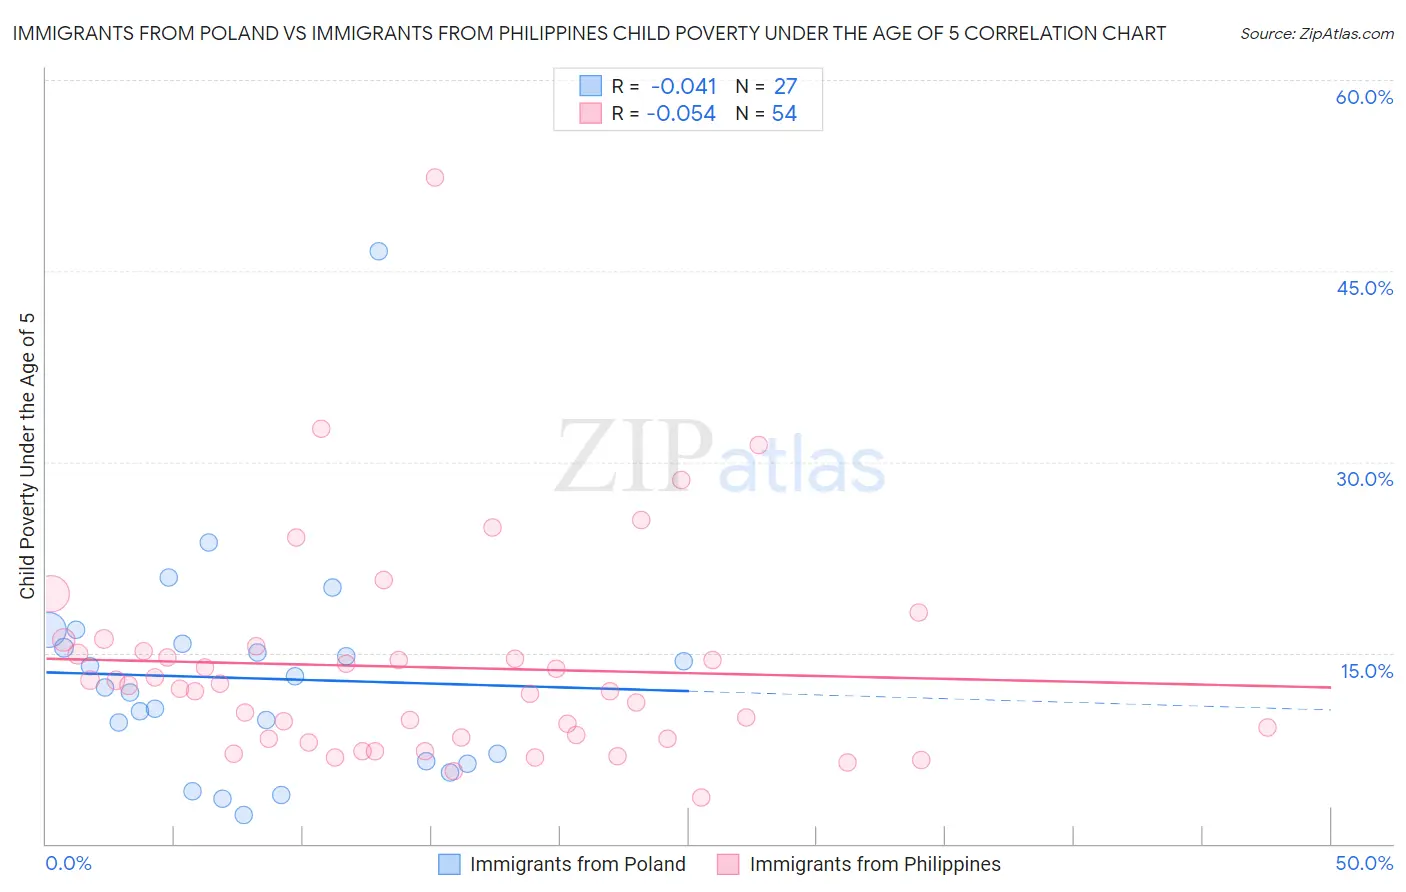
Immigrants from Poland vs Immigrants from Philippines Child Poverty Under the Age of 5 Correlation Chart
The statistical analysis conducted on geographies consisting of 290,713,862 people shows no correlation between the proportion of Immigrants from Poland and poverty level among children under the age of 5 in the United States with a correlation coefficient (R) of -0.041 and weighted average of 15.1%. Similarly, the statistical analysis conducted on geographies consisting of 449,552,748 people shows a slight negative correlation between the proportion of Immigrants from Philippines and poverty level among children under the age of 5 in the United States with a correlation coefficient (R) of -0.054 and weighted average of 14.7%, a difference of 2.8%.
Child Poverty Under the Age of 5 Correlation Summary
| Measurement | Immigrants from Poland | Immigrants from Philippines |
| Minimum | 2.2% | 3.7% |
| Maximum | 46.5% | 52.4% |
| Range | 44.3% | 48.7% |
| Mean | 13.0% | 13.9% |
| Median | 12.3% | 12.3% |
| Interquartile 25% (IQ1) | 6.5% | 8.3% |
| Interquartile 75% (IQ3) | 15.7% | 15.1% |
| Interquartile Range (IQR) | 9.2% | 6.8% |
| Standard Deviation (Sample) | 8.7% | 8.4% |
| Standard Deviation (Population) | 8.6% | 8.3% |
Demographics Similar to Immigrants from Poland and Immigrants from Philippines by Child Poverty Under the Age of 5
In terms of child poverty under the age of 5, the demographic groups most similar to Immigrants from Poland are Immigrants from Eastern Europe (15.1%, a difference of 0.12%), Immigrants from Russia (15.0%, a difference of 0.81%), Paraguayan (15.0%, a difference of 0.90%), Swedish (15.0%, a difference of 1.1%), and Egyptian (14.9%, a difference of 1.1%). Similarly, the demographic groups most similar to Immigrants from Philippines are Soviet Union (14.7%, a difference of 0.13%), Immigrants from Greece (14.7%, a difference of 0.13%), Laotian (14.7%, a difference of 0.13%), Tsimshian (14.7%, a difference of 0.20%), and Russian (14.8%, a difference of 0.34%).
| Demographics | Rating | Rank | Child Poverty Under the Age of 5 |
| Soviet Union | 99.7 /100 | #42 | Exceptional 14.7% |
| Immigrants | Greece | 99.7 /100 | #43 | Exceptional 14.7% |
| Immigrants | Philippines | 99.7 /100 | #44 | Exceptional 14.7% |
| Laotians | 99.6 /100 | #45 | Exceptional 14.7% |
| Tsimshian | 99.6 /100 | #46 | Exceptional 14.7% |
| Russians | 99.6 /100 | #47 | Exceptional 14.8% |
| Immigrants | Czechoslovakia | 99.6 /100 | #48 | Exceptional 14.8% |
| Immigrants | Bulgaria | 99.6 /100 | #49 | Exceptional 14.8% |
| Immigrants | Northern Europe | 99.6 /100 | #50 | Exceptional 14.8% |
| Estonians | 99.6 /100 | #51 | Exceptional 14.8% |
| Immigrants | Serbia | 99.5 /100 | #52 | Exceptional 14.9% |
| Luxembourgers | 99.4 /100 | #53 | Exceptional 14.9% |
| Immigrants | Israel | 99.4 /100 | #54 | Exceptional 14.9% |
| Danes | 99.4 /100 | #55 | Exceptional 14.9% |
| Immigrants | Pakistan | 99.4 /100 | #56 | Exceptional 14.9% |
| Egyptians | 99.4 /100 | #57 | Exceptional 14.9% |
| Swedes | 99.4 /100 | #58 | Exceptional 15.0% |
| Paraguayans | 99.4 /100 | #59 | Exceptional 15.0% |
| Immigrants | Russia | 99.3 /100 | #60 | Exceptional 15.0% |
| Immigrants | Poland | 99.1 /100 | #61 | Exceptional 15.1% |
| Immigrants | Eastern Europe | 99.1 /100 | #62 | Exceptional 15.1% |