Immigrants from Poland vs Croatian Child Poverty Under the Age of 5
COMPARE
Immigrants from Poland
Croatian
Child Poverty Under the Age of 5
Child Poverty Under the Age of 5 Comparison
Immigrants from Poland
Croatians
15.1%
CHILD POVERTY UNDER THE AGE OF 5
99.1/ 100
METRIC RATING
61st/ 347
METRIC RANK
15.4%
CHILD POVERTY UNDER THE AGE OF 5
98.5/ 100
METRIC RATING
76th/ 347
METRIC RANK
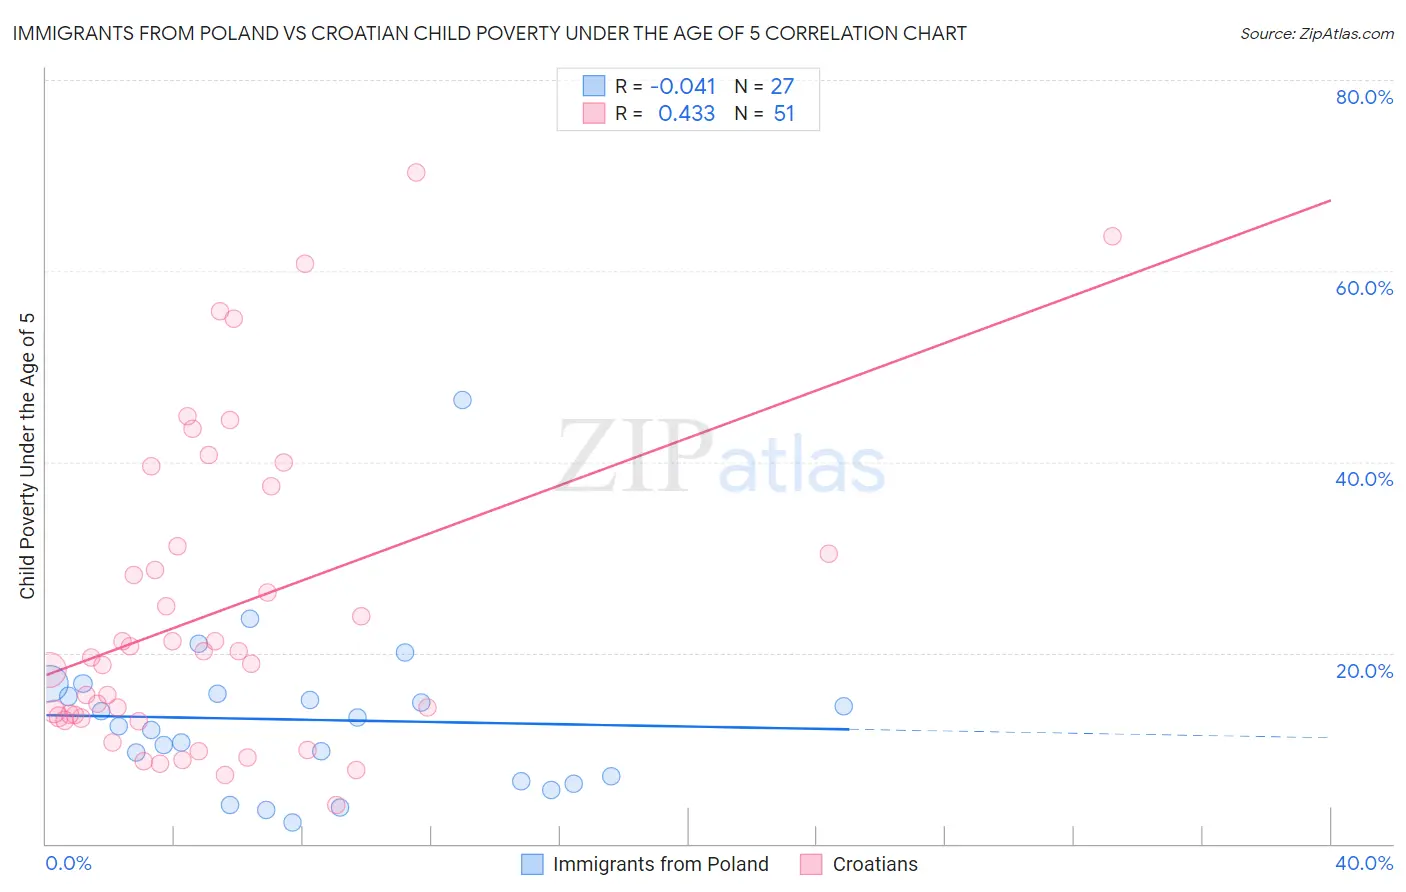
Immigrants from Poland vs Croatian Child Poverty Under the Age of 5 Correlation Chart
The statistical analysis conducted on geographies consisting of 290,713,862 people shows no correlation between the proportion of Immigrants from Poland and poverty level among children under the age of 5 in the United States with a correlation coefficient (R) of -0.041 and weighted average of 15.1%. Similarly, the statistical analysis conducted on geographies consisting of 358,262,773 people shows a moderate positive correlation between the proportion of Croatians and poverty level among children under the age of 5 in the United States with a correlation coefficient (R) of 0.433 and weighted average of 15.4%, a difference of 1.8%.
Child Poverty Under the Age of 5 Correlation Summary
| Measurement | Immigrants from Poland | Croatian |
| Minimum | 2.2% | 4.0% |
| Maximum | 46.5% | 70.3% |
| Range | 44.3% | 66.3% |
| Mean | 13.0% | 24.3% |
| Median | 12.3% | 19.6% |
| Interquartile 25% (IQ1) | 6.5% | 13.2% |
| Interquartile 75% (IQ3) | 15.7% | 31.2% |
| Interquartile Range (IQR) | 9.2% | 18.0% |
| Standard Deviation (Sample) | 8.7% | 16.3% |
| Standard Deviation (Population) | 8.6% | 16.1% |
Demographics Similar to Immigrants from Poland and Croatians by Child Poverty Under the Age of 5
In terms of child poverty under the age of 5, the demographic groups most similar to Immigrants from Poland are Immigrants from Eastern Europe (15.1%, a difference of 0.12%), Immigrants from Europe (15.1%, a difference of 0.25%), Immigrants from Romania (15.2%, a difference of 0.27%), Immigrants from Fiji (15.2%, a difference of 0.30%), and Immigrants from Scotland (15.2%, a difference of 0.42%). Similarly, the demographic groups most similar to Croatians are Immigrants from Argentina (15.4%, a difference of 0.0%), Argentinean (15.4%, a difference of 0.15%), Immigrants from Turkey (15.4%, a difference of 0.21%), Immigrants from Ukraine (15.3%, a difference of 0.51%), and Sri Lankan (15.5%, a difference of 0.54%).
| Demographics | Rating | Rank | Child Poverty Under the Age of 5 |
| Swedes | 99.4 /100 | #58 | Exceptional 15.0% |
| Paraguayans | 99.4 /100 | #59 | Exceptional 15.0% |
| Immigrants | Russia | 99.3 /100 | #60 | Exceptional 15.0% |
| Immigrants | Poland | 99.1 /100 | #61 | Exceptional 15.1% |
| Immigrants | Eastern Europe | 99.1 /100 | #62 | Exceptional 15.1% |
| Immigrants | Europe | 99.1 /100 | #63 | Exceptional 15.1% |
| Immigrants | Romania | 99.1 /100 | #64 | Exceptional 15.2% |
| Immigrants | Fiji | 99.0 /100 | #65 | Exceptional 15.2% |
| Immigrants | Scotland | 99.0 /100 | #66 | Exceptional 15.2% |
| Greeks | 99.0 /100 | #67 | Exceptional 15.2% |
| Zimbabweans | 99.0 /100 | #68 | Exceptional 15.2% |
| Lithuanians | 99.0 /100 | #69 | Exceptional 15.2% |
| Immigrants | Belgium | 98.8 /100 | #70 | Exceptional 15.3% |
| Immigrants | Egypt | 98.8 /100 | #71 | Exceptional 15.3% |
| Immigrants | Sweden | 98.8 /100 | #72 | Exceptional 15.3% |
| Immigrants | Ukraine | 98.7 /100 | #73 | Exceptional 15.3% |
| Argentineans | 98.5 /100 | #74 | Exceptional 15.4% |
| Immigrants | Argentina | 98.5 /100 | #75 | Exceptional 15.4% |
| Croatians | 98.5 /100 | #76 | Exceptional 15.4% |
| Immigrants | Turkey | 98.3 /100 | #77 | Exceptional 15.4% |
| Sri Lankans | 98.1 /100 | #78 | Exceptional 15.5% |