Maltese vs Luxembourger Male Poverty
COMPARE
Maltese
Luxembourger
Male Poverty
Male Poverty Comparison
Maltese
Luxembourgers
9.1%
MALE POVERTY
100.0/ 100
METRIC RATING
5th/ 347
METRIC RANK
9.5%
MALE POVERTY
99.8/ 100
METRIC RATING
16th/ 347
METRIC RANK
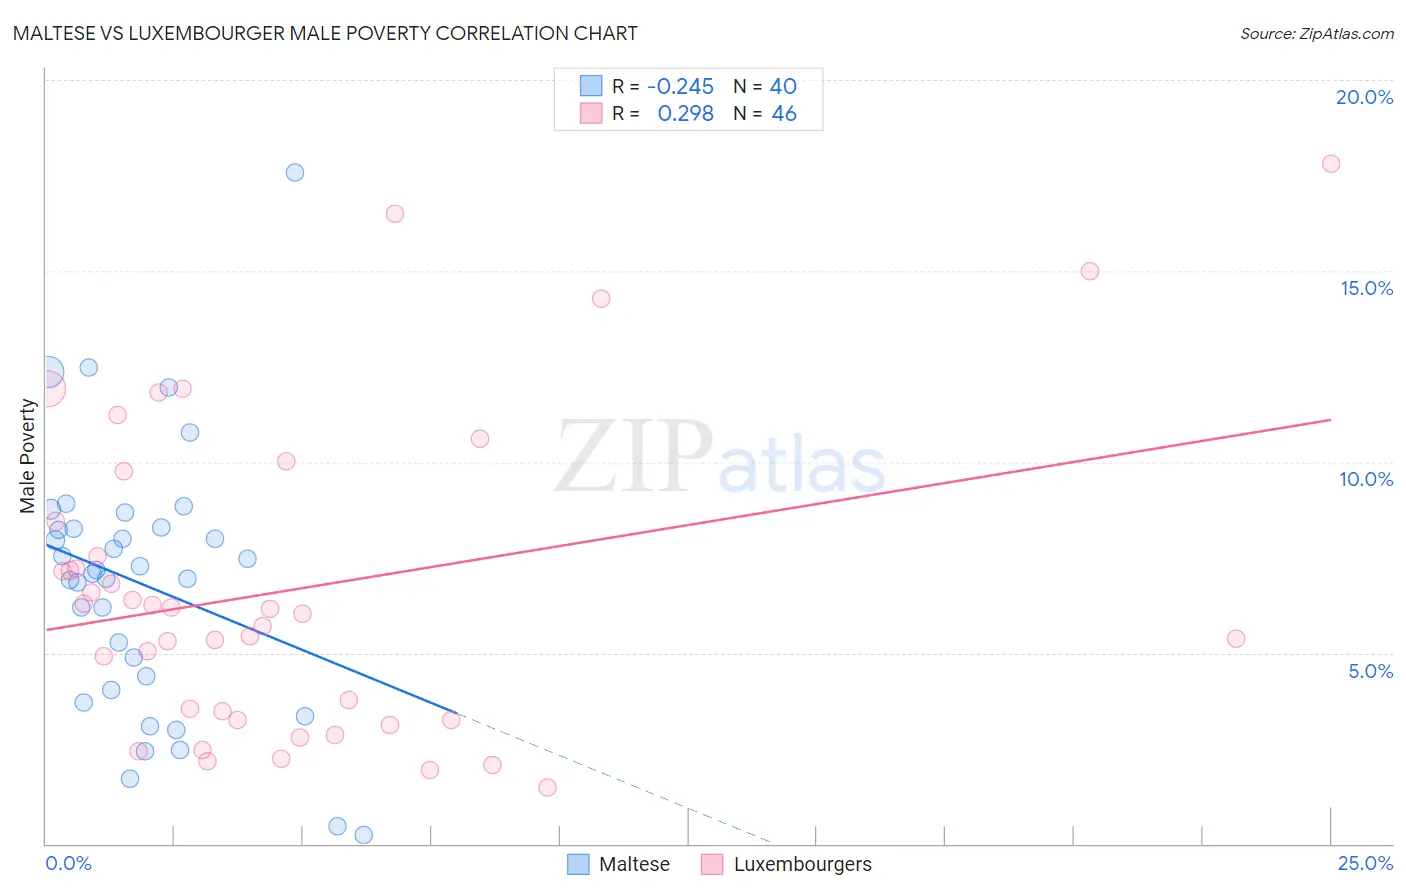
Maltese vs Luxembourger Male Poverty Correlation Chart
The statistical analysis conducted on geographies consisting of 126,413,393 people shows a weak negative correlation between the proportion of Maltese and poverty level among males in the United States with a correlation coefficient (R) of -0.245 and weighted average of 9.1%. Similarly, the statistical analysis conducted on geographies consisting of 144,631,125 people shows a weak positive correlation between the proportion of Luxembourgers and poverty level among males in the United States with a correlation coefficient (R) of 0.298 and weighted average of 9.5%, a difference of 4.9%.
Male Poverty Correlation Summary
| Measurement | Maltese | Luxembourger |
| Minimum | 0.22% | 1.5% |
| Maximum | 17.6% | 17.8% |
| Range | 17.3% | 16.3% |
| Mean | 6.8% | 6.7% |
| Median | 7.1% | 6.1% |
| Interquartile 25% (IQ1) | 4.2% | 3.2% |
| Interquartile 75% (IQ3) | 8.3% | 8.4% |
| Interquartile Range (IQR) | 4.1% | 5.2% |
| Standard Deviation (Sample) | 3.5% | 4.1% |
| Standard Deviation (Population) | 3.4% | 4.0% |
Demographics Similar to Maltese and Luxembourgers by Male Poverty
In terms of male poverty, the demographic groups most similar to Maltese are Assyrian/Chaldean/Syriac (9.1%, a difference of 0.66%), Immigrants from Ireland (9.1%, a difference of 0.75%), Filipino (9.2%, a difference of 1.4%), Immigrants from Taiwan (8.9%, a difference of 2.0%), and Immigrants from South Central Asia (9.3%, a difference of 2.2%). Similarly, the demographic groups most similar to Luxembourgers are Norwegian (9.5%, a difference of 0.13%), Lithuanian (9.5%, a difference of 0.30%), Immigrants from Hong Kong (9.6%, a difference of 0.48%), Bhutanese (9.5%, a difference of 0.52%), and Latvian (9.6%, a difference of 0.58%).
| Demographics | Rating | Rank | Male Poverty |
| Immigrants | India | 100.0 /100 | #1 | Exceptional 8.2% |
| Chinese | 100.0 /100 | #2 | Exceptional 8.7% |
| Thais | 100.0 /100 | #3 | Exceptional 8.7% |
| Immigrants | Taiwan | 100.0 /100 | #4 | Exceptional 8.9% |
| Maltese | 100.0 /100 | #5 | Exceptional 9.1% |
| Assyrians/Chaldeans/Syriacs | 99.9 /100 | #6 | Exceptional 9.1% |
| Immigrants | Ireland | 99.9 /100 | #7 | Exceptional 9.1% |
| Filipinos | 99.9 /100 | #8 | Exceptional 9.2% |
| Immigrants | South Central Asia | 99.9 /100 | #9 | Exceptional 9.3% |
| Bulgarians | 99.9 /100 | #10 | Exceptional 9.3% |
| Bolivians | 99.9 /100 | #11 | Exceptional 9.4% |
| Immigrants | Bolivia | 99.9 /100 | #12 | Exceptional 9.4% |
| Immigrants | Lithuania | 99.9 /100 | #13 | Exceptional 9.4% |
| Immigrants | North Macedonia | 99.8 /100 | #14 | Exceptional 9.4% |
| Bhutanese | 99.8 /100 | #15 | Exceptional 9.5% |
| Luxembourgers | 99.8 /100 | #16 | Exceptional 9.5% |
| Norwegians | 99.8 /100 | #17 | Exceptional 9.5% |
| Lithuanians | 99.8 /100 | #18 | Exceptional 9.5% |
| Immigrants | Hong Kong | 99.7 /100 | #19 | Exceptional 9.6% |
| Latvians | 99.7 /100 | #20 | Exceptional 9.6% |