Cajun vs Luxembourger Male Poverty

COMPARE

Cajun
Race
Ancestry
AfghanAfricanAlaska NativeAlaskan AthabascanAlbanianAleutAlsatianAmericanApacheArabArapahoArgentineanArmenianAssyrian/Chaldean/SyriacAustralianAustrianBahamianBangladeshiBarbadianBasqueBelgianBelizeanBermudanBhutaneseBlackfeetBolivianBrazilianBritishBritish West IndianBulgarianBurmeseCajunCambodianCanadianCape VerdeanCarpatho RusynCelticCentral AmericanCentral American IndianCherokeeCheyenneChickasawChileanChineseChippewaChoctawColombianColvilleComancheCosta RicanCreeCreekCroatianCrowCubanCypriotCzechCzechoslovakianDanishDelawareDominicanDutchDutch West IndianEastern EuropeanEcuadorianEgyptianEnglishEstonianEthiopianEuropeanFijianFilipinoFinnishFrenchFrench American IndianFrench CanadianGermanGerman RussianGhanaianGreekGuamanian/ChamorroGuatemalanGuyaneseHaitianHmongHonduranHopiHoumaHungarianIcelanderIndian (Asian)IndonesianInupiatIranianIraqiIrishIroquoisIsraeliItalianJamaicanJapaneseJordanianKenyanKiowaKoreanLaotianLatvianLebaneseLiberianLithuanianLumbeeMacedonianMalaysianMalteseMarshalleseMenomineeMexicanMexican American IndianMongolianMoroccanNative HawaiianNavajoNepaleseNew ZealanderNicaraguanNigerianNorthern EuropeanNorwegianOkinawanOsageOttawaPaiutePakistaniPalestinianPanamanianParaguayanPennsylvania GermanPeruvianPimaPolishPortuguesePotawatomiPuebloPuerto RicanPuget Sound SalishRomanianRussianSalvadoranSamoanScandinavianScotch-IrishScottishSeminoleSenegaleseSerbianShoshoneSierra LeoneanSiouxSlavicSlovakSloveneSomaliSouth AfricanSouth AmericanSouth American IndianSoviet UnionSpaniardSpanishSpanish AmericanSpanish American IndianSri LankanSubsaharan AfricanSudaneseSwedishSwissSyrianTaiwaneseThaiTlingit-HaidaTohono O'OdhamTonganTrinidadian and TobagonianTsimshianTurkishU.S. Virgin IslanderUgandanUkrainianUruguayanUteVenezuelanVietnameseWelshWest IndianYakamaYaquiYugoslavianYumanYup'ikZimbabwean
Immigration
NonimmigrantsImmigrantsAfghanistanAfricaAlbaniaArgentinaArmeniaAsiaAustraliaAustriaBahamasBangladeshBarbadosBelarusBelgiumBelizeBoliviaBosnia and HerzegovinaBrazilBulgariaBurma/MyanmarCabo VerdeCambodiaCameroonCanadaCaribbeanCentral AmericaChileChinaColombiaCongoCosta RicaCroatiaCubaCzechoslovakiaDenmarkDominicaDominican RepublicEastern AfricaEastern AsiaEastern EuropeEcuadorEgyptEl SalvadorEnglandEritreaEthiopiaEuropeFijiFranceGermanyGhanaGreeceGrenadaGuatemalaGuyanaHaitiHondurasHong KongHungaryIndiaIndonesiaIranIraqIrelandIsraelItalyJamaicaJapanJordanKazakhstanKenyaKoreaKuwaitLaosLatin AmericaLatviaLebanonLiberiaLithuaniaMalaysiaMexicoMicronesiaMiddle AfricaMoldovaMoroccoNepalNetherlandsNicaraguaNigeriaNorth AmericaNorth MacedoniaNorthern AfricaNorthern EuropeNorwayOceaniaPakistanPanamaPeruPhilippinesPolandPortugalRomaniaRussiaSaudi ArabiaScotlandSenegalSerbiaSierra LeoneSingaporeSomaliaSouth AfricaSouth AmericaSouth Central AsiaSouth Eastern AsiaSouthern EuropeSpainSri LankaSt. Vincent and the GrenadinesSudanSwedenSwitzerlandSyriaTaiwanThailandTrinidad and TobagoTurkeyUgandaUkraineUruguayUzbekistanVenezuelaVietnamWest IndiesWestern AfricaWestern AsiaWestern EuropeYemenZaireZimbabweAzores
Luxembourger
Race
Ancestry
AfghanAfricanAlaska NativeAlaskan AthabascanAlbanianAleutAlsatianAmericanApacheArabArapahoArgentineanArmenianAssyrian/Chaldean/SyriacAustralianAustrianBahamianBangladeshiBarbadianBasqueBelgianBelizeanBermudanBhutaneseBlackfeetBolivianBrazilianBritishBritish West IndianBulgarianBurmeseCambodianCanadianCape VerdeanCarpatho RusynCelticCentral AmericanCentral American IndianCherokeeCheyenneChickasawChileanChineseChippewaChoctawColombianColvilleComancheCosta RicanCreeCreekCroatianCrowCubanCypriotCzechCzechoslovakianDanishDelawareDominicanDutchDutch West IndianEastern EuropeanEcuadorianEgyptianEnglishEstonianEthiopianEuropeanFijianFilipinoFinnishFrenchFrench American IndianFrench CanadianGermanGerman RussianGhanaianGreekGuamanian/ChamorroGuatemalanGuyaneseHaitianHmongHonduranHopiHoumaHungarianIcelanderIndian (Asian)IndonesianInupiatIranianIraqiIrishIroquoisIsraeliItalianJamaicanJapaneseJordanianKenyanKiowaKoreanLaotianLatvianLebaneseLiberianLithuanianLumbeeLuxembourgerMacedonianMalaysianMalteseMarshalleseMenomineeMexicanMexican American IndianMongolianMoroccanNative HawaiianNavajoNepaleseNew ZealanderNicaraguanNigerianNorthern EuropeanNorwegianOkinawanOsageOttawaPaiutePakistaniPalestinianPanamanianParaguayanPennsylvania GermanPeruvianPimaPolishPortuguesePotawatomiPuebloPuerto RicanPuget Sound SalishRomanianRussianSalvadoranSamoanScandinavianScotch-IrishScottishSeminoleSenegaleseSerbianShoshoneSierra LeoneanSiouxSlavicSlovakSloveneSomaliSouth AfricanSouth AmericanSouth American IndianSoviet UnionSpaniardSpanishSpanish AmericanSpanish American IndianSri LankanSubsaharan AfricanSudaneseSwedishSwissSyrianTaiwaneseThaiTlingit-HaidaTohono O'OdhamTonganTrinidadian and TobagonianTsimshianTurkishU.S. Virgin IslanderUgandanUkrainianUruguayanUteVenezuelanVietnameseWelshWest IndianYakamaYaquiYugoslavianYumanYup'ikZimbabwean
Immigration
NonimmigrantsImmigrantsAfghanistanAfricaAlbaniaArgentinaArmeniaAsiaAustraliaAustriaBahamasBangladeshBarbadosBelarusBelgiumBelizeBoliviaBosnia and HerzegovinaBrazilBulgariaBurma/MyanmarCabo VerdeCambodiaCameroonCanadaCaribbeanCentral AmericaChileChinaColombiaCongoCosta RicaCroatiaCubaCzechoslovakiaDenmarkDominicaDominican RepublicEastern AfricaEastern AsiaEastern EuropeEcuadorEgyptEl SalvadorEnglandEritreaEthiopiaEuropeFijiFranceGermanyGhanaGreeceGrenadaGuatemalaGuyanaHaitiHondurasHong KongHungaryIndiaIndonesiaIranIraqIrelandIsraelItalyJamaicaJapanJordanKazakhstanKenyaKoreaKuwaitLaosLatin AmericaLatviaLebanonLiberiaLithuaniaMalaysiaMexicoMicronesiaMiddle AfricaMoldovaMoroccoNepalNetherlandsNicaraguaNigeriaNorth AmericaNorth MacedoniaNorthern AfricaNorthern EuropeNorwayOceaniaPakistanPanamaPeruPhilippinesPolandPortugalRomaniaRussiaSaudi ArabiaScotlandSenegalSerbiaSierra LeoneSingaporeSomaliaSouth AfricaSouth AmericaSouth Central AsiaSouth Eastern AsiaSouthern EuropeSpainSri LankaSt. Vincent and the GrenadinesSudanSwedenSwitzerlandSyriaTaiwanThailandTrinidad and TobagoTurkeyUgandaUkraineUruguayUzbekistanVenezuelaVietnamWest IndiesWestern AfricaWestern AsiaWestern EuropeYemenZaireZimbabweAzores
Male Poverty
Income
Poverty
Unemployment
Labor Participation
Family Structure
Vehicle Availability
Education Level
Disability

Male Poverty Comparison

Cajuns

Luxembourgers

Tragic
Exceptional
13.9%
MALE POVERTY
0.0/ 100
METRIC RATING
296th/ 347
METRIC RANK
9.5%
MALE POVERTY
99.8/ 100
METRIC RATING
16th/ 347
METRIC RANK

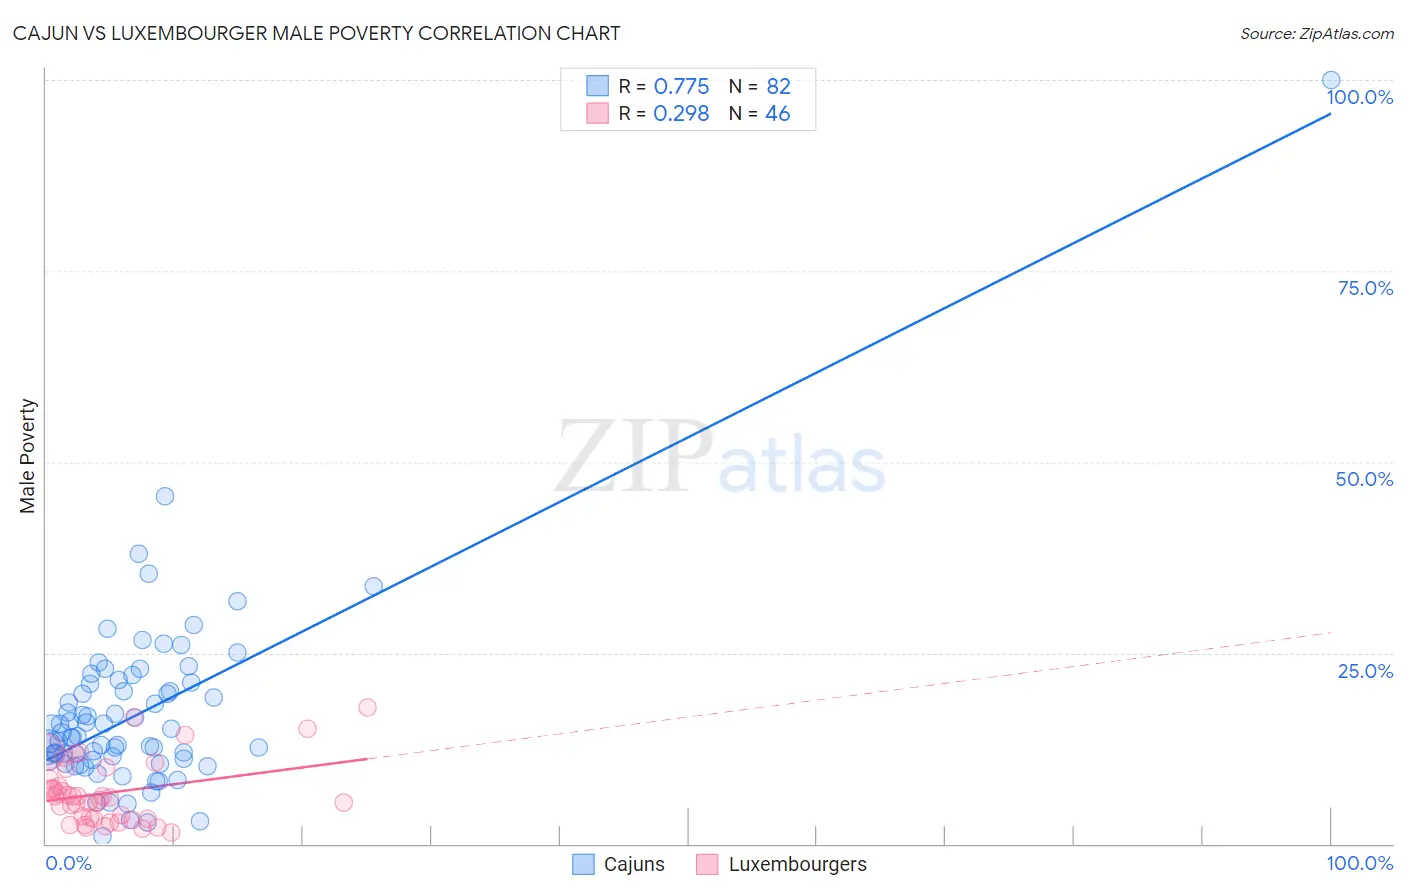
Cajun vs Luxembourger Male Poverty Correlation Chart

The statistical analysis conducted on geographies consisting of 149,683,084 people shows a strong positive correlation between the proportion of Cajuns and poverty level among males in the United States with a correlation coefficient (R) of 0.775 and weighted average of 13.9%. Similarly, the statistical analysis conducted on geographies consisting of 144,631,125 people shows a weak positive correlation between the proportion of Luxembourgers and poverty level among males in the United States with a correlation coefficient (R) of 0.298 and weighted average of 9.5%, a difference of 46.2%.
Cajun vs Luxembourger Male Poverty

Male Poverty Correlation Summary

MeasurementCajunLuxembourger
Minimum0.97%1.5%
Maximum100.0%17.8%
Range99.0%16.3%
Mean17.0%6.7%
Median13.9%6.1%
Interquartile 25% (IQ1)10.9%3.2%
Interquartile 75% (IQ3)20.9%8.4%
Interquartile Range (IQR)10.0%5.2%
Standard Deviation (Sample)12.4%4.1%
Standard Deviation (Population)12.3%4.0%

Similar Demographics by Male Poverty

Demographics Similar to Cajuns by Male Poverty

In terms of male poverty, the demographic groups most similar to Cajuns are Immigrants from Central America (13.9%, a difference of 0.11%), Hispanic or Latino (13.9%, a difference of 0.40%), Immigrants from Belize (13.8%, a difference of 0.45%), Indonesian (13.8%, a difference of 0.46%), and Vietnamese (13.8%, a difference of 0.63%).
DemographicsRating | RankMale Poverty
Guatemalans
0.0
/100
|
#289
Tragic
13.8%
Immigrants | Zaire
0.0
/100
|
#290
Tragic
13.8%
Vietnamese
0.0
/100
|
#291
Tragic
13.8%
Indonesians
0.0
/100
|
#292
Tragic
13.8%
Immigrants | Belize
0.0
/100
|
#293
Tragic
13.8%
Hispanics or Latinos
0.0
/100
|
#294
Tragic
13.9%
Immigrants | Central America
0.0
/100
|
#295
Tragic
13.9%
Cajuns
0.0
/100
|
#296
Tragic
13.9%
Inupiat
0.0
/100
|
#297
Tragic
14.0%
Blackfeet
0.0
/100
|
#298
Tragic
14.0%
Immigrants | Guatemala
0.0
/100
|
#299
Tragic
14.0%
Immigrants | Mexico
0.0
/100
|
#300
Tragic
14.0%
Immigrants | Senegal
0.0
/100
|
#301
Tragic
14.0%
Immigrants | Caribbean
0.0
/100
|
#302
Tragic
14.0%
Bahamians
0.0
/100
|
#303
Tragic
14.1%

Demographics Similar to Luxembourgers by Male Poverty

In terms of male poverty, the demographic groups most similar to Luxembourgers are Norwegian (9.5%, a difference of 0.13%), Lithuanian (9.5%, a difference of 0.30%), Immigrants from Hong Kong (9.6%, a difference of 0.48%), Bhutanese (9.5%, a difference of 0.52%), and Latvian (9.6%, a difference of 0.58%).
DemographicsRating | RankMale Poverty
Immigrants | South Central Asia
99.9
/100
|
#9
Exceptional
9.3%
Bulgarians
99.9
/100
|
#10
Exceptional
9.3%
Bolivians
99.9
/100
|
#11
Exceptional
9.4%
Immigrants | Bolivia
99.9
/100
|
#12
Exceptional
9.4%
Immigrants | Lithuania
99.9
/100
|
#13
Exceptional
9.4%
Immigrants | North Macedonia
99.8
/100
|
#14
Exceptional
9.4%
Bhutanese
99.8
/100
|
#15
Exceptional
9.5%
Luxembourgers
99.8
/100
|
#16
Exceptional
9.5%
Norwegians
99.8
/100
|
#17
Exceptional
9.5%
Lithuanians
99.8
/100
|
#18
Exceptional
9.5%
Immigrants | Hong Kong
99.7
/100
|
#19
Exceptional
9.6%
Latvians
99.7
/100
|
#20
Exceptional
9.6%
Immigrants | Scotland
99.7
/100
|
#21
Exceptional
9.6%
Croatians
99.7
/100
|
#22
Exceptional
9.6%
Italians
99.7
/100
|
#23
Exceptional
9.6%