Immigrants from Philippines vs Panamanian Male Poverty
COMPARE
Immigrants from Philippines
Panamanian
Male Poverty
Male Poverty Comparison
Immigrants from Philippines
Panamanians
10.0%
MALE POVERTY
98.7/ 100
METRIC RATING
50th/ 347
METRIC RANK
11.9%
MALE POVERTY
6.2/ 100
METRIC RATING
205th/ 347
METRIC RANK
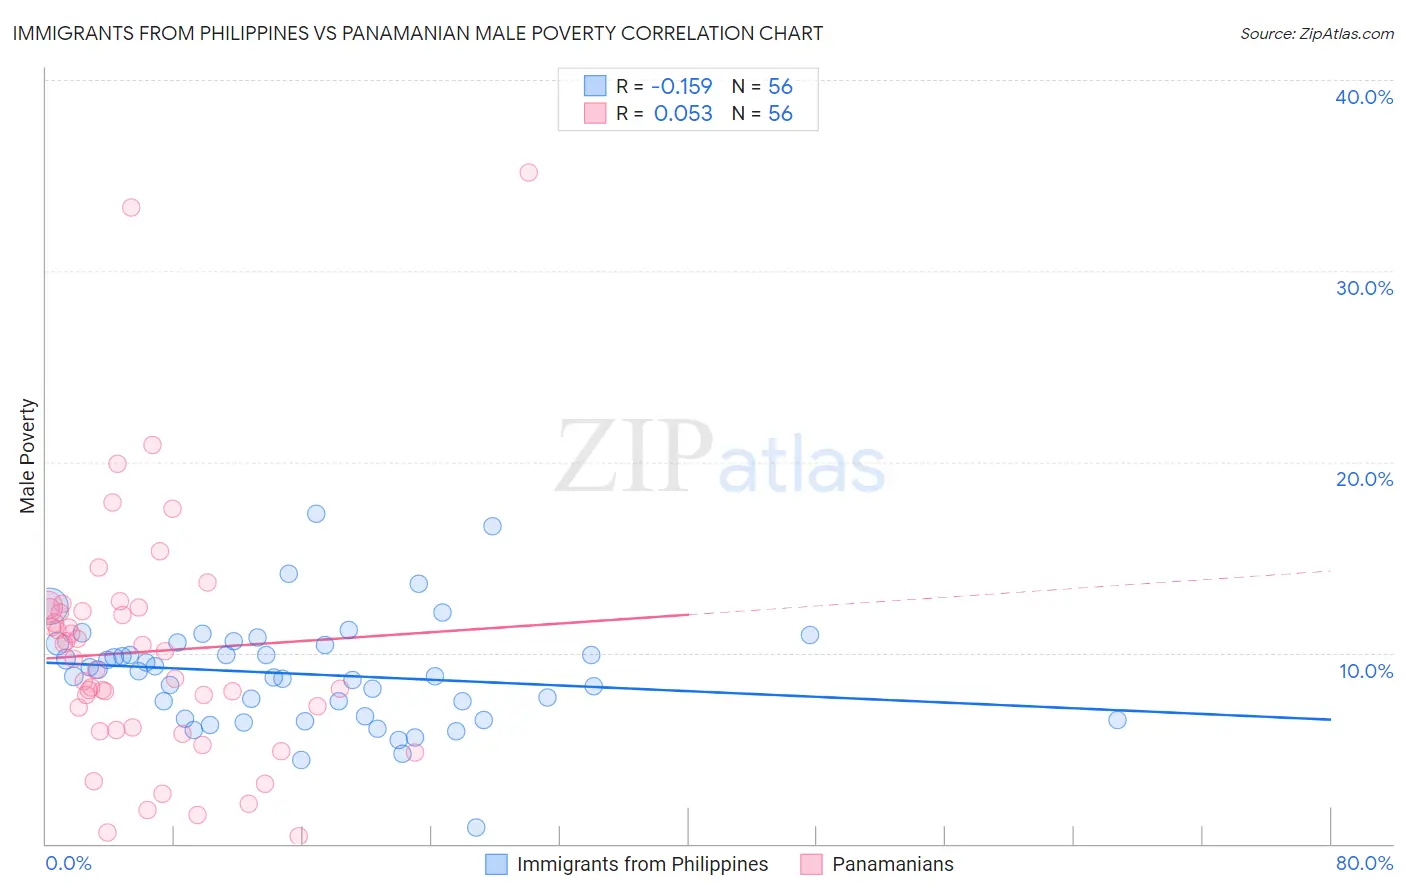
Immigrants from Philippines vs Panamanian Male Poverty Correlation Chart
The statistical analysis conducted on geographies consisting of 470,810,616 people shows a poor negative correlation between the proportion of Immigrants from Philippines and poverty level among males in the United States with a correlation coefficient (R) of -0.159 and weighted average of 10.0%. Similarly, the statistical analysis conducted on geographies consisting of 281,029,832 people shows a slight positive correlation between the proportion of Panamanians and poverty level among males in the United States with a correlation coefficient (R) of 0.053 and weighted average of 11.9%, a difference of 19.4%.
Male Poverty Correlation Summary
| Measurement | Immigrants from Philippines | Panamanian |
| Minimum | 0.87% | 0.40% |
| Maximum | 17.3% | 35.1% |
| Range | 16.4% | 34.7% |
| Mean | 8.9% | 10.1% |
| Median | 8.9% | 9.4% |
| Interquartile 25% (IQ1) | 6.6% | 6.0% |
| Interquartile 75% (IQ3) | 10.4% | 12.2% |
| Interquartile Range (IQR) | 3.8% | 6.2% |
| Standard Deviation (Sample) | 2.8% | 6.5% |
| Standard Deviation (Population) | 2.8% | 6.5% |
Similar Demographics by Male Poverty
Demographics Similar to Immigrants from Philippines by Male Poverty
In terms of male poverty, the demographic groups most similar to Immigrants from Philippines are Slovene (10.0%, a difference of 0.050%), Immigrants from Croatia (10.0%, a difference of 0.10%), Immigrants from Japan (10.0%, a difference of 0.14%), Immigrants from Singapore (10.0%, a difference of 0.15%), and Asian (10.0%, a difference of 0.19%).
| Demographics | Rating | Rank | Male Poverty |
| Immigrants | Moldova | 99.0 /100 | #43 | Exceptional 9.9% |
| Immigrants | Romania | 98.9 /100 | #44 | Exceptional 9.9% |
| Immigrants | Serbia | 98.9 /100 | #45 | Exceptional 10.0% |
| Turks | 98.9 /100 | #46 | Exceptional 10.0% |
| Immigrants | Singapore | 98.8 /100 | #47 | Exceptional 10.0% |
| Immigrants | Japan | 98.8 /100 | #48 | Exceptional 10.0% |
| Slovenes | 98.8 /100 | #49 | Exceptional 10.0% |
| Immigrants | Philippines | 98.7 /100 | #50 | Exceptional 10.0% |
| Immigrants | Croatia | 98.7 /100 | #51 | Exceptional 10.0% |
| Asians | 98.7 /100 | #52 | Exceptional 10.0% |
| Immigrants | Czechoslovakia | 98.6 /100 | #53 | Exceptional 10.0% |
| Immigrants | Austria | 98.5 /100 | #54 | Exceptional 10.0% |
| Germans | 98.3 /100 | #55 | Exceptional 10.1% |
| Immigrants | Bulgaria | 98.2 /100 | #56 | Exceptional 10.1% |
| Estonians | 98.1 /100 | #57 | Exceptional 10.1% |
Demographics Similar to Panamanians by Male Poverty
In terms of male poverty, the demographic groups most similar to Panamanians are Immigrants from Eastern Africa (12.0%, a difference of 0.35%), Malaysian (12.0%, a difference of 0.45%), Immigrants from Uganda (11.8%, a difference of 0.78%), Immigrants (12.0%, a difference of 0.78%), and Immigrants from the Azores (12.0%, a difference of 0.90%).
| Demographics | Rating | Rank | Male Poverty |
| Iraqis | 14.7 /100 | #198 | Poor 11.7% |
| Spanish | 14.1 /100 | #199 | Poor 11.7% |
| Immigrants | Lebanon | 13.6 /100 | #200 | Poor 11.7% |
| Spaniards | 13.5 /100 | #201 | Poor 11.7% |
| Aleuts | 10.4 /100 | #202 | Poor 11.8% |
| Immigrants | Western Asia | 9.8 /100 | #203 | Tragic 11.8% |
| Immigrants | Uganda | 8.5 /100 | #204 | Tragic 11.8% |
| Panamanians | 6.2 /100 | #205 | Tragic 11.9% |
| Immigrants | Eastern Africa | 5.4 /100 | #206 | Tragic 12.0% |
| Malaysians | 5.2 /100 | #207 | Tragic 12.0% |
| Immigrants | Immigrants | 4.5 /100 | #208 | Tragic 12.0% |
| Immigrants | Azores | 4.3 /100 | #209 | Tragic 12.0% |
| Moroccans | 4.2 /100 | #210 | Tragic 12.0% |
| Immigrants | Panama | 4.0 /100 | #211 | Tragic 12.1% |
| Americans | 3.2 /100 | #212 | Tragic 12.1% |