Immigrants from Philippines vs Danish Child Poverty Among Boys Under 16
COMPARE
Immigrants from Philippines
Danish
Child Poverty Among Boys Under 16
Child Poverty Among Boys Under 16 Comparison
Immigrants from Philippines
Danes
14.3%
CHILD POVERTY AMONG BOYS UNDER 16
99.0/ 100
METRIC RATING
53rd/ 347
METRIC RANK
13.6%
CHILD POVERTY AMONG BOYS UNDER 16
99.8/ 100
METRIC RATING
33rd/ 347
METRIC RANK
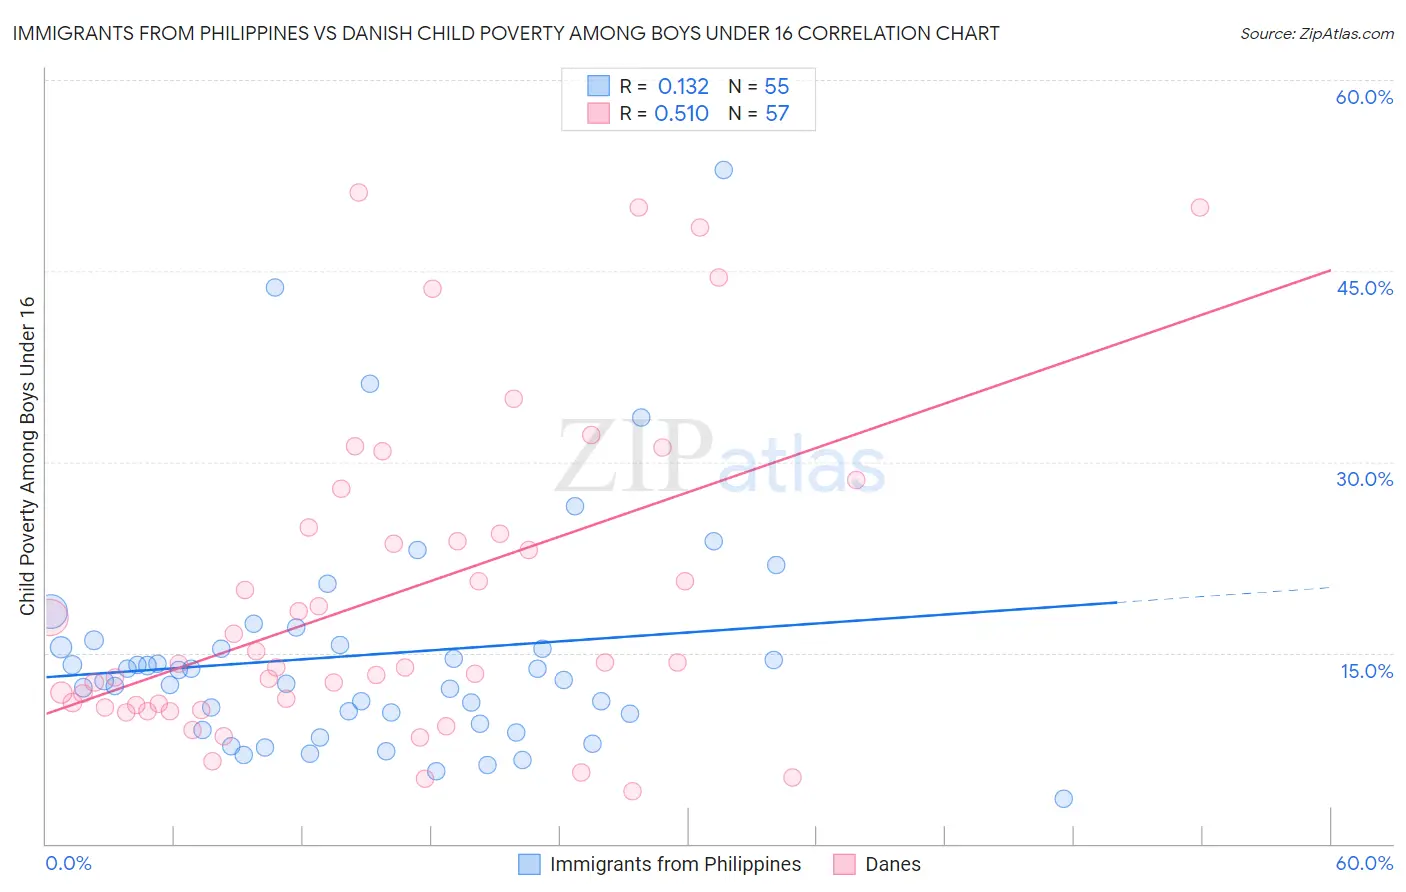
Immigrants from Philippines vs Danish Child Poverty Among Boys Under 16 Correlation Chart
The statistical analysis conducted on geographies consisting of 461,906,754 people shows a poor positive correlation between the proportion of Immigrants from Philippines and poverty level among boys under the age of 16 in the United States with a correlation coefficient (R) of 0.132 and weighted average of 14.3%. Similarly, the statistical analysis conducted on geographies consisting of 461,554,581 people shows a substantial positive correlation between the proportion of Danes and poverty level among boys under the age of 16 in the United States with a correlation coefficient (R) of 0.510 and weighted average of 13.6%, a difference of 5.2%.
Child Poverty Among Boys Under 16 Correlation Summary
| Measurement | Immigrants from Philippines | Danish |
| Minimum | 3.6% | 4.1% |
| Maximum | 52.9% | 51.2% |
| Range | 49.4% | 47.0% |
| Mean | 14.9% | 19.3% |
| Median | 12.9% | 14.1% |
| Interquartile 25% (IQ1) | 9.5% | 10.8% |
| Interquartile 75% (IQ3) | 15.7% | 24.6% |
| Interquartile Range (IQR) | 6.2% | 13.8% |
| Standard Deviation (Sample) | 9.1% | 12.4% |
| Standard Deviation (Population) | 9.0% | 12.3% |
Demographics Similar to Immigrants from Philippines and Danes by Child Poverty Among Boys Under 16
In terms of child poverty among boys under 16, the demographic groups most similar to Immigrants from Philippines are Laotian (14.3%, a difference of 0.040%), Immigrants from Greece (14.2%, a difference of 0.73%), Italian (14.2%, a difference of 0.86%), Czech (14.1%, a difference of 1.3%), and Immigrants from Indonesia (14.1%, a difference of 1.4%). Similarly, the demographic groups most similar to Danes are Assyrian/Chaldean/Syriac (13.6%, a difference of 0.11%), Russian (13.8%, a difference of 1.1%), Luxembourger (13.8%, a difference of 1.4%), Immigrants from Sri Lanka (13.9%, a difference of 1.8%), and Immigrants from Northern Europe (13.9%, a difference of 2.0%).
| Demographics | Rating | Rank | Child Poverty Among Boys Under 16 |
| Danes | 99.8 /100 | #33 | Exceptional 13.6% |
| Assyrians/Chaldeans/Syriacs | 99.8 /100 | #34 | Exceptional 13.6% |
| Russians | 99.7 /100 | #35 | Exceptional 13.8% |
| Luxembourgers | 99.7 /100 | #36 | Exceptional 13.8% |
| Immigrants | Sri Lanka | 99.6 /100 | #37 | Exceptional 13.9% |
| Immigrants | Northern Europe | 99.6 /100 | #38 | Exceptional 13.9% |
| Immigrants | Australia | 99.6 /100 | #39 | Exceptional 13.9% |
| Immigrants | Asia | 99.6 /100 | #40 | Exceptional 13.9% |
| Lithuanians | 99.6 /100 | #41 | Exceptional 14.0% |
| Koreans | 99.6 /100 | #42 | Exceptional 14.0% |
| Croatians | 99.5 /100 | #43 | Exceptional 14.0% |
| Estonians | 99.4 /100 | #44 | Exceptional 14.1% |
| Immigrants | Scotland | 99.4 /100 | #45 | Exceptional 14.1% |
| Greeks | 99.4 /100 | #46 | Exceptional 14.1% |
| Immigrants | Moldova | 99.4 /100 | #47 | Exceptional 14.1% |
| Immigrants | Indonesia | 99.4 /100 | #48 | Exceptional 14.1% |
| Czechs | 99.3 /100 | #49 | Exceptional 14.1% |
| Italians | 99.2 /100 | #50 | Exceptional 14.2% |
| Immigrants | Greece | 99.2 /100 | #51 | Exceptional 14.2% |
| Laotians | 99.0 /100 | #52 | Exceptional 14.3% |
| Immigrants | Philippines | 99.0 /100 | #53 | Exceptional 14.3% |