Immigrants from Philippines vs Immigrants from Western Europe Child Poverty Among Boys Under 16
COMPARE
Immigrants from Philippines
Immigrants from Western Europe
Child Poverty Among Boys Under 16
Child Poverty Among Boys Under 16 Comparison
Immigrants from Philippines
Immigrants from Western Europe
14.3%
CHILD POVERTY AMONG BOYS UNDER 16
99.0/ 100
METRIC RATING
53rd/ 347
METRIC RANK
15.4%
CHILD POVERTY AMONG BOYS UNDER 16
90.0/ 100
METRIC RATING
131st/ 347
METRIC RANK
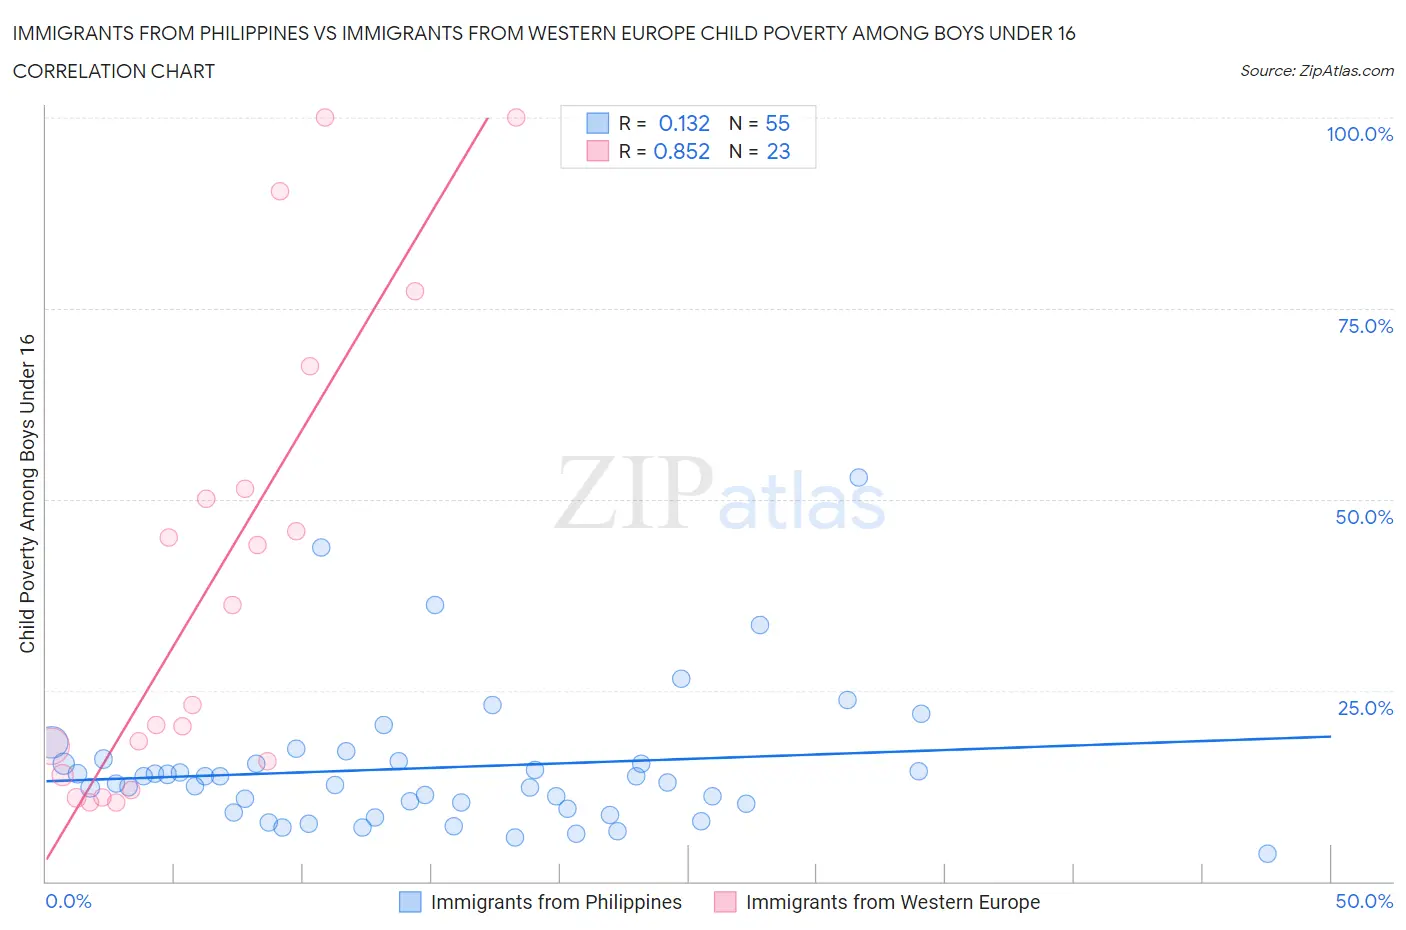
Immigrants from Philippines vs Immigrants from Western Europe Child Poverty Among Boys Under 16 Correlation Chart
The statistical analysis conducted on geographies consisting of 461,906,754 people shows a poor positive correlation between the proportion of Immigrants from Philippines and poverty level among boys under the age of 16 in the United States with a correlation coefficient (R) of 0.132 and weighted average of 14.3%. Similarly, the statistical analysis conducted on geographies consisting of 481,702,204 people shows a very strong positive correlation between the proportion of Immigrants from Western Europe and poverty level among boys under the age of 16 in the United States with a correlation coefficient (R) of 0.852 and weighted average of 15.4%, a difference of 7.7%.
Child Poverty Among Boys Under 16 Correlation Summary
| Measurement | Immigrants from Philippines | Immigrants from Western Europe |
| Minimum | 3.6% | 10.3% |
| Maximum | 52.9% | 100.0% |
| Range | 49.4% | 89.7% |
| Mean | 14.9% | 38.8% |
| Median | 12.9% | 23.0% |
| Interquartile 25% (IQ1) | 9.5% | 13.9% |
| Interquartile 75% (IQ3) | 15.7% | 51.3% |
| Interquartile Range (IQR) | 6.2% | 37.4% |
| Standard Deviation (Sample) | 9.1% | 29.9% |
| Standard Deviation (Population) | 9.0% | 29.3% |
Similar Demographics by Child Poverty Among Boys Under 16
Demographics Similar to Immigrants from Philippines by Child Poverty Among Boys Under 16
In terms of child poverty among boys under 16, the demographic groups most similar to Immigrants from Philippines are Laotian (14.3%, a difference of 0.040%), Immigrants from Serbia (14.3%, a difference of 0.080%), Immigrants from Pakistan (14.3%, a difference of 0.13%), Zimbabwean (14.3%, a difference of 0.13%), and Polish (14.4%, a difference of 0.24%).
| Demographics | Rating | Rank | Child Poverty Among Boys Under 16 |
| Greeks | 99.4 /100 | #46 | Exceptional 14.1% |
| Immigrants | Moldova | 99.4 /100 | #47 | Exceptional 14.1% |
| Immigrants | Indonesia | 99.4 /100 | #48 | Exceptional 14.1% |
| Czechs | 99.3 /100 | #49 | Exceptional 14.1% |
| Italians | 99.2 /100 | #50 | Exceptional 14.2% |
| Immigrants | Greece | 99.2 /100 | #51 | Exceptional 14.2% |
| Laotians | 99.0 /100 | #52 | Exceptional 14.3% |
| Immigrants | Philippines | 99.0 /100 | #53 | Exceptional 14.3% |
| Immigrants | Serbia | 99.0 /100 | #54 | Exceptional 14.3% |
| Immigrants | Pakistan | 99.0 /100 | #55 | Exceptional 14.3% |
| Zimbabweans | 99.0 /100 | #56 | Exceptional 14.3% |
| Poles | 98.9 /100 | #57 | Exceptional 14.4% |
| Immigrants | Sweden | 98.9 /100 | #58 | Exceptional 14.4% |
| Immigrants | Czechoslovakia | 98.9 /100 | #59 | Exceptional 14.4% |
| Immigrants | Belgium | 98.9 /100 | #60 | Exceptional 14.4% |
Demographics Similar to Immigrants from Western Europe by Child Poverty Among Boys Under 16
In terms of child poverty among boys under 16, the demographic groups most similar to Immigrants from Western Europe are Mongolian (15.4%, a difference of 0.060%), Immigrants from Brazil (15.4%, a difference of 0.080%), Canadian (15.4%, a difference of 0.20%), Carpatho Rusyn (15.4%, a difference of 0.39%), and Palestinian (15.4%, a difference of 0.43%).
| Demographics | Rating | Rank | Child Poverty Among Boys Under 16 |
| Tlingit-Haida | 92.2 /100 | #124 | Exceptional 15.3% |
| Czechoslovakians | 92.1 /100 | #125 | Exceptional 15.3% |
| Palestinians | 91.3 /100 | #126 | Exceptional 15.4% |
| Carpatho Rusyns | 91.1 /100 | #127 | Exceptional 15.4% |
| Canadians | 90.6 /100 | #128 | Exceptional 15.4% |
| Immigrants | Brazil | 90.3 /100 | #129 | Exceptional 15.4% |
| Mongolians | 90.2 /100 | #130 | Exceptional 15.4% |
| Immigrants | Western Europe | 90.0 /100 | #131 | Exceptional 15.4% |
| Immigrants | Kazakhstan | 88.7 /100 | #132 | Excellent 15.5% |
| Welsh | 88.3 /100 | #133 | Excellent 15.5% |
| Peruvians | 88.1 /100 | #134 | Excellent 15.5% |
| Portuguese | 87.5 /100 | #135 | Excellent 15.5% |
| Icelanders | 87.5 /100 | #136 | Excellent 15.5% |
| Immigrants | Spain | 87.1 /100 | #137 | Excellent 15.6% |
| Immigrants | Southern Europe | 86.5 /100 | #138 | Excellent 15.6% |