Immigrants from Ecuador vs Danish Child Poverty Among Boys Under 16
COMPARE
Immigrants from Ecuador
Danish
Child Poverty Among Boys Under 16
Child Poverty Among Boys Under 16 Comparison
Immigrants from Ecuador
Danes
19.8%
CHILD POVERTY AMONG BOYS UNDER 16
0.1/ 100
METRIC RATING
272nd/ 347
METRIC RANK
13.6%
CHILD POVERTY AMONG BOYS UNDER 16
99.8/ 100
METRIC RATING
33rd/ 347
METRIC RANK
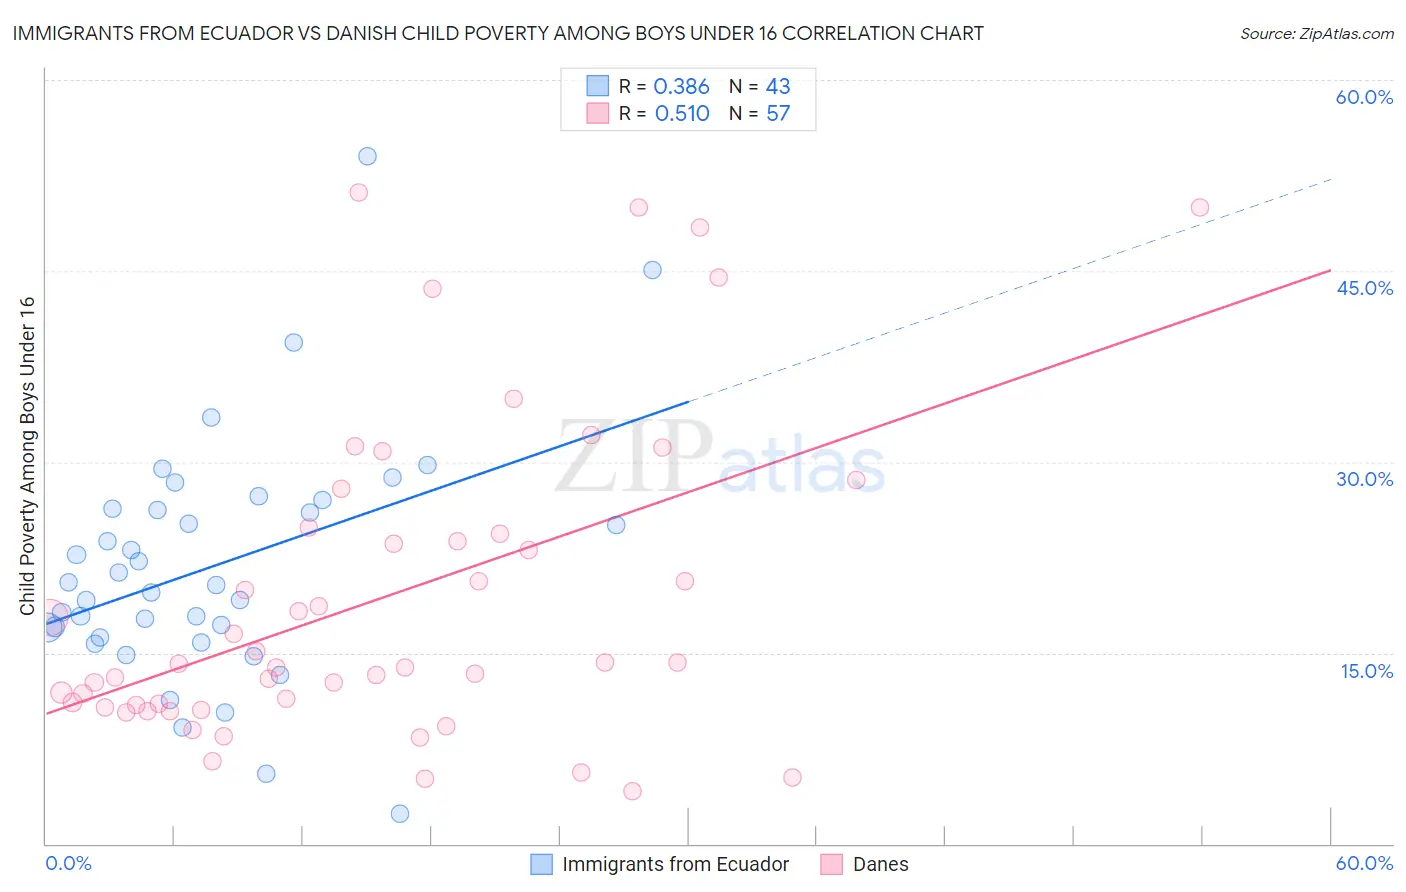
Immigrants from Ecuador vs Danish Child Poverty Among Boys Under 16 Correlation Chart
The statistical analysis conducted on geographies consisting of 267,854,704 people shows a mild positive correlation between the proportion of Immigrants from Ecuador and poverty level among boys under the age of 16 in the United States with a correlation coefficient (R) of 0.386 and weighted average of 19.8%. Similarly, the statistical analysis conducted on geographies consisting of 461,554,581 people shows a substantial positive correlation between the proportion of Danes and poverty level among boys under the age of 16 in the United States with a correlation coefficient (R) of 0.510 and weighted average of 13.6%, a difference of 45.8%.
Child Poverty Among Boys Under 16 Correlation Summary
| Measurement | Immigrants from Ecuador | Danish |
| Minimum | 2.4% | 4.1% |
| Maximum | 54.0% | 51.2% |
| Range | 51.6% | 47.0% |
| Mean | 21.7% | 19.3% |
| Median | 20.4% | 14.1% |
| Interquartile 25% (IQ1) | 16.2% | 10.8% |
| Interquartile 75% (IQ3) | 26.3% | 24.6% |
| Interquartile Range (IQR) | 10.1% | 13.8% |
| Standard Deviation (Sample) | 9.6% | 12.4% |
| Standard Deviation (Population) | 9.5% | 12.3% |
Similar Demographics by Child Poverty Among Boys Under 16
Demographics Similar to Immigrants from Ecuador by Child Poverty Among Boys Under 16
In terms of child poverty among boys under 16, the demographic groups most similar to Immigrants from Ecuador are Belizean (19.9%, a difference of 0.14%), Chickasaw (19.8%, a difference of 0.22%), Immigrants from Bangladesh (19.9%, a difference of 0.39%), Jamaican (20.0%, a difference of 0.52%), and Subsaharan African (20.0%, a difference of 0.69%).
| Demographics | Rating | Rank | Child Poverty Among Boys Under 16 |
| Guyanese | 0.1 /100 | #265 | Tragic 19.6% |
| Immigrants | El Salvador | 0.1 /100 | #266 | Tragic 19.6% |
| Vietnamese | 0.1 /100 | #267 | Tragic 19.6% |
| Spanish American Indians | 0.1 /100 | #268 | Tragic 19.6% |
| Immigrants | Cabo Verde | 0.1 /100 | #269 | Tragic 19.7% |
| Cherokee | 0.1 /100 | #270 | Tragic 19.7% |
| Chickasaw | 0.1 /100 | #271 | Tragic 19.8% |
| Immigrants | Ecuador | 0.1 /100 | #272 | Tragic 19.8% |
| Belizeans | 0.1 /100 | #273 | Tragic 19.9% |
| Immigrants | Bangladesh | 0.0 /100 | #274 | Tragic 19.9% |
| Jamaicans | 0.0 /100 | #275 | Tragic 20.0% |
| Sub-Saharan Africans | 0.0 /100 | #276 | Tragic 20.0% |
| Immigrants | Barbados | 0.0 /100 | #277 | Tragic 20.0% |
| Immigrants | West Indies | 0.0 /100 | #278 | Tragic 20.0% |
| Bangladeshis | 0.0 /100 | #279 | Tragic 20.0% |
Demographics Similar to Danes by Child Poverty Among Boys Under 16
In terms of child poverty among boys under 16, the demographic groups most similar to Danes are Assyrian/Chaldean/Syriac (13.6%, a difference of 0.11%), Immigrants from China (13.6%, a difference of 0.18%), Turkish (13.6%, a difference of 0.27%), Swedish (13.6%, a difference of 0.35%), and Cypriot (13.6%, a difference of 0.45%).
| Demographics | Rating | Rank | Child Poverty Among Boys Under 16 |
| Immigrants | Bolivia | 99.8 /100 | #26 | Exceptional 13.5% |
| Asians | 99.8 /100 | #27 | Exceptional 13.5% |
| Eastern Europeans | 99.8 /100 | #28 | Exceptional 13.5% |
| Cypriots | 99.8 /100 | #29 | Exceptional 13.6% |
| Swedes | 99.8 /100 | #30 | Exceptional 13.6% |
| Turks | 99.8 /100 | #31 | Exceptional 13.6% |
| Immigrants | China | 99.8 /100 | #32 | Exceptional 13.6% |
| Danes | 99.8 /100 | #33 | Exceptional 13.6% |
| Assyrians/Chaldeans/Syriacs | 99.8 /100 | #34 | Exceptional 13.6% |
| Russians | 99.7 /100 | #35 | Exceptional 13.8% |
| Luxembourgers | 99.7 /100 | #36 | Exceptional 13.8% |
| Immigrants | Sri Lanka | 99.6 /100 | #37 | Exceptional 13.9% |
| Immigrants | Northern Europe | 99.6 /100 | #38 | Exceptional 13.9% |
| Immigrants | Australia | 99.6 /100 | #39 | Exceptional 13.9% |
| Immigrants | Asia | 99.6 /100 | #40 | Exceptional 13.9% |