Immigrants from Philippines vs Danish No Schooling Completed
COMPARE
Immigrants from Philippines
Danish
No Schooling Completed
No Schooling Completed Comparison
Immigrants from Philippines
Danes
2.6%
NO SCHOOLING COMPLETED
0.1/ 100
METRIC RATING
277th/ 347
METRIC RANK
1.5%
NO SCHOOLING COMPLETED
100.0/ 100
METRIC RATING
18th/ 347
METRIC RANK
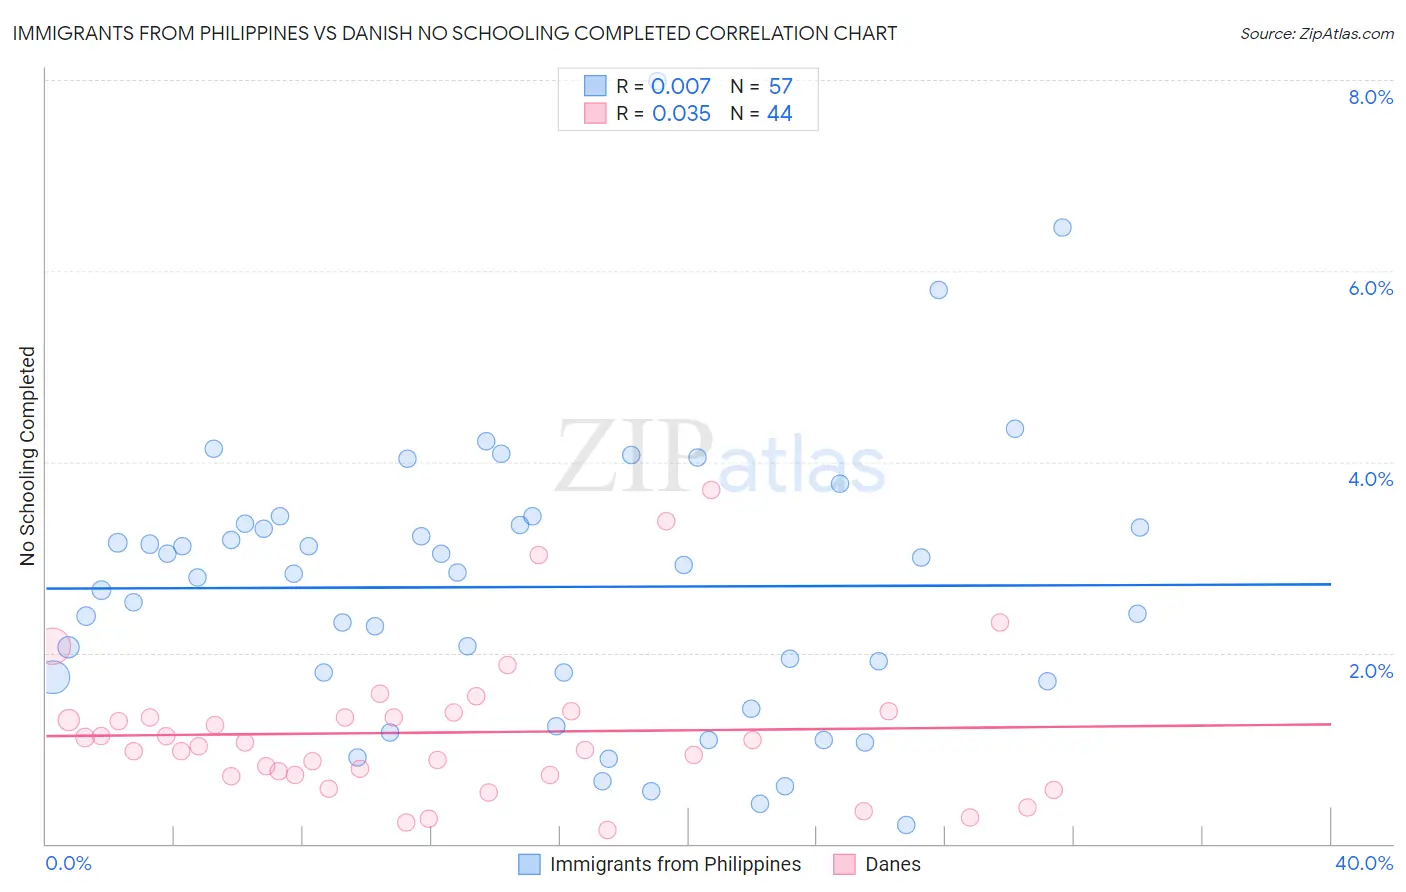
Immigrants from Philippines vs Danish No Schooling Completed Correlation Chart
The statistical analysis conducted on geographies consisting of 465,179,873 people shows no correlation between the proportion of Immigrants from Philippines and percentage of population with no schooling in the United States with a correlation coefficient (R) of 0.007 and weighted average of 2.6%. Similarly, the statistical analysis conducted on geographies consisting of 463,663,322 people shows no correlation between the proportion of Danes and percentage of population with no schooling in the United States with a correlation coefficient (R) of 0.035 and weighted average of 1.5%, a difference of 76.1%.
No Schooling Completed Correlation Summary
| Measurement | Immigrants from Philippines | Danish |
| Minimum | 0.20% | 0.15% |
| Maximum | 8.0% | 3.7% |
| Range | 7.8% | 3.6% |
| Mean | 2.7% | 1.2% |
| Median | 2.8% | 1.0% |
| Interquartile 25% (IQ1) | 1.7% | 0.72% |
| Interquartile 75% (IQ3) | 3.3% | 1.3% |
| Interquartile Range (IQR) | 1.6% | 0.62% |
| Standard Deviation (Sample) | 1.5% | 0.77% |
| Standard Deviation (Population) | 1.5% | 0.76% |
Similar Demographics by No Schooling Completed
Demographics Similar to Immigrants from Philippines by No Schooling Completed
In terms of no schooling completed, the demographic groups most similar to Immigrants from Philippines are Immigrants from Western Africa (2.6%, a difference of 0.050%), Immigrants from Uzbekistan (2.6%, a difference of 0.20%), Immigrants from China (2.6%, a difference of 0.61%), Barbadian (2.6%, a difference of 0.74%), and Trinidadian and Tobagonian (2.6%, a difference of 0.76%).
| Demographics | Rating | Rank | No Schooling Completed |
| Immigrants | Peru | 0.2 /100 | #270 | Tragic 2.5% |
| Cubans | 0.2 /100 | #271 | Tragic 2.5% |
| Immigrants | Bolivia | 0.2 /100 | #272 | Tragic 2.5% |
| Immigrants | Cameroon | 0.1 /100 | #273 | Tragic 2.5% |
| Ghanaians | 0.1 /100 | #274 | Tragic 2.6% |
| Immigrants | China | 0.1 /100 | #275 | Tragic 2.6% |
| Immigrants | Western Africa | 0.1 /100 | #276 | Tragic 2.6% |
| Immigrants | Philippines | 0.1 /100 | #277 | Tragic 2.6% |
| Immigrants | Uzbekistan | 0.1 /100 | #278 | Tragic 2.6% |
| Barbadians | 0.1 /100 | #279 | Tragic 2.6% |
| Trinidadians and Tobagonians | 0.1 /100 | #280 | Tragic 2.6% |
| Afghans | 0.1 /100 | #281 | Tragic 2.6% |
| Immigrants | Ghana | 0.1 /100 | #282 | Tragic 2.6% |
| Immigrants | Trinidad and Tobago | 0.0 /100 | #283 | Tragic 2.6% |
| Immigrants | West Indies | 0.0 /100 | #284 | Tragic 2.7% |
Demographics Similar to Danes by No Schooling Completed
In terms of no schooling completed, the demographic groups most similar to Danes are Alaskan Athabascan (1.5%, a difference of 0.10%), Welsh (1.5%, a difference of 0.23%), Croatian (1.5%, a difference of 0.30%), Finnish (1.5%, a difference of 0.31%), and Chinese (1.5%, a difference of 0.60%).
| Demographics | Rating | Rank | No Schooling Completed |
| Lithuanians | 100.0 /100 | #11 | Exceptional 1.4% |
| Irish | 100.0 /100 | #12 | Exceptional 1.4% |
| Poles | 100.0 /100 | #13 | Exceptional 1.4% |
| Scotch-Irish | 100.0 /100 | #14 | Exceptional 1.5% |
| Tlingit-Haida | 100.0 /100 | #15 | Exceptional 1.5% |
| Finns | 100.0 /100 | #16 | Exceptional 1.5% |
| Croatians | 100.0 /100 | #17 | Exceptional 1.5% |
| Danes | 100.0 /100 | #18 | Exceptional 1.5% |
| Alaskan Athabascans | 100.0 /100 | #19 | Exceptional 1.5% |
| Welsh | 100.0 /100 | #20 | Exceptional 1.5% |
| Chinese | 100.0 /100 | #21 | Exceptional 1.5% |
| Alaska Natives | 100.0 /100 | #22 | Exceptional 1.5% |
| Europeans | 100.0 /100 | #23 | Exceptional 1.5% |
| Pennsylvania Germans | 100.0 /100 | #24 | Exceptional 1.5% |
| French | 100.0 /100 | #25 | Exceptional 1.5% |