Immigrants from Peru vs Portuguese Female Poverty Among 25-34 Year Olds
COMPARE
Immigrants from Peru
Portuguese
Female Poverty Among 25-34 Year Olds
Female Poverty Among 25-34 Year Olds Comparison
Immigrants from Peru
Portuguese
12.7%
FEMALE POVERTY AMONG 25-34 YEAR OLDS
94.3/ 100
METRIC RATING
109th/ 347
METRIC RANK
13.6%
FEMALE POVERTY AMONG 25-34 YEAR OLDS
40.3/ 100
METRIC RATING
183rd/ 347
METRIC RANK
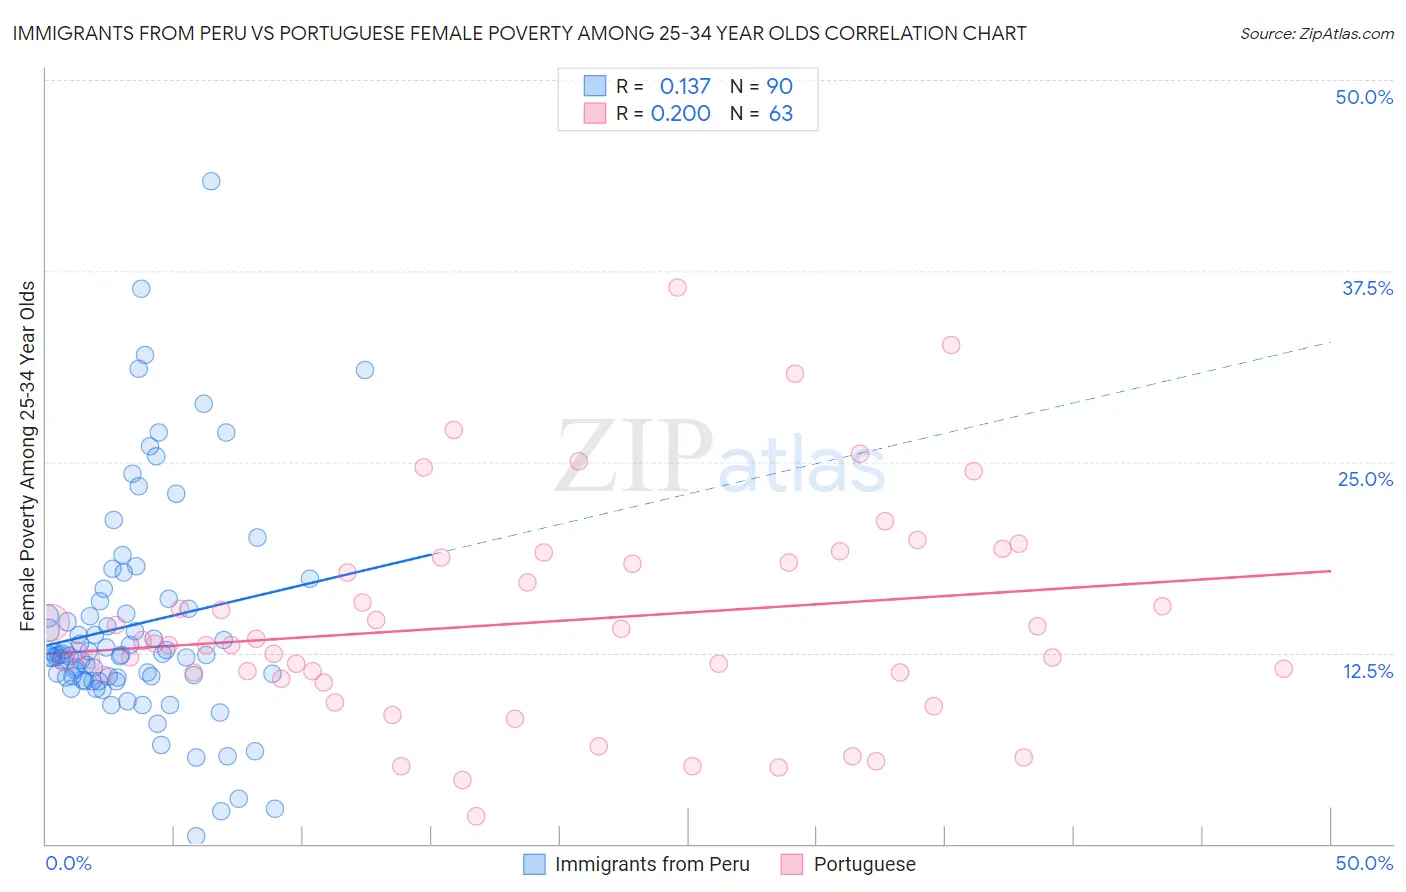
Immigrants from Peru vs Portuguese Female Poverty Among 25-34 Year Olds Correlation Chart
The statistical analysis conducted on geographies consisting of 325,150,333 people shows a poor positive correlation between the proportion of Immigrants from Peru and poverty level among females between the ages 25 and 34 in the United States with a correlation coefficient (R) of 0.137 and weighted average of 12.7%. Similarly, the statistical analysis conducted on geographies consisting of 439,781,405 people shows a weak positive correlation between the proportion of Portuguese and poverty level among females between the ages 25 and 34 in the United States with a correlation coefficient (R) of 0.200 and weighted average of 13.6%, a difference of 7.1%.
Female Poverty Among 25-34 Year Olds Correlation Summary
| Measurement | Immigrants from Peru | Portuguese |
| Minimum | 0.53% | 1.8% |
| Maximum | 43.4% | 36.4% |
| Range | 42.9% | 34.6% |
| Mean | 14.4% | 14.5% |
| Median | 12.4% | 13.0% |
| Interquartile 25% (IQ1) | 10.9% | 11.1% |
| Interquartile 75% (IQ3) | 15.9% | 18.5% |
| Interquartile Range (IQR) | 5.0% | 7.4% |
| Standard Deviation (Sample) | 7.3% | 7.0% |
| Standard Deviation (Population) | 7.3% | 6.9% |
Similar Demographics by Female Poverty Among 25-34 Year Olds
Demographics Similar to Immigrants from Peru by Female Poverty Among 25-34 Year Olds
In terms of female poverty among 25-34 year olds, the demographic groups most similar to Immigrants from Peru are Immigrants from Norway (12.7%, a difference of 0.030%), Australian (12.8%, a difference of 0.080%), Danish (12.8%, a difference of 0.15%), Immigrants from Morocco (12.8%, a difference of 0.17%), and Immigrants from Syria (12.8%, a difference of 0.20%).
| Demographics | Rating | Rank | Female Poverty Among 25-34 Year Olds |
| Peruvians | 95.6 /100 | #102 | Exceptional 12.7% |
| Immigrants | Spain | 95.5 /100 | #103 | Exceptional 12.7% |
| Swedes | 95.4 /100 | #104 | Exceptional 12.7% |
| Immigrants | South Africa | 95.3 /100 | #105 | Exceptional 12.7% |
| Tsimshian | 95.1 /100 | #106 | Exceptional 12.7% |
| Poles | 94.9 /100 | #107 | Exceptional 12.7% |
| Immigrants | Norway | 94.4 /100 | #108 | Exceptional 12.7% |
| Immigrants | Peru | 94.3 /100 | #109 | Exceptional 12.7% |
| Australians | 94.1 /100 | #110 | Exceptional 12.8% |
| Danes | 93.9 /100 | #111 | Exceptional 12.8% |
| Immigrants | Morocco | 93.9 /100 | #112 | Exceptional 12.8% |
| Immigrants | Syria | 93.8 /100 | #113 | Exceptional 12.8% |
| Immigrants | Southern Europe | 93.6 /100 | #114 | Exceptional 12.8% |
| Immigrants | Brazil | 93.3 /100 | #115 | Exceptional 12.8% |
| Chileans | 93.2 /100 | #116 | Exceptional 12.8% |
Demographics Similar to Portuguese by Female Poverty Among 25-34 Year Olds
In terms of female poverty among 25-34 year olds, the demographic groups most similar to Portuguese are Immigrants from Venezuela (13.6%, a difference of 0.030%), Guamanian/Chamorro (13.6%, a difference of 0.10%), German (13.6%, a difference of 0.11%), Immigrants from Eastern Africa (13.6%, a difference of 0.28%), and Czechoslovakian (13.7%, a difference of 0.31%).
| Demographics | Rating | Rank | Female Poverty Among 25-34 Year Olds |
| Yugoslavians | 45.0 /100 | #176 | Average 13.6% |
| Venezuelans | 44.6 /100 | #177 | Average 13.6% |
| Canadians | 44.3 /100 | #178 | Average 13.6% |
| Immigrants | Eastern Africa | 43.6 /100 | #179 | Average 13.6% |
| Germans | 41.6 /100 | #180 | Average 13.6% |
| Guamanians/Chamorros | 41.5 /100 | #181 | Average 13.6% |
| Immigrants | Venezuela | 40.7 /100 | #182 | Average 13.6% |
| Portuguese | 40.3 /100 | #183 | Average 13.6% |
| Czechoslovakians | 36.8 /100 | #184 | Fair 13.7% |
| Irish | 35.3 /100 | #185 | Fair 13.7% |
| Immigrants | Uruguay | 34.1 /100 | #186 | Fair 13.7% |
| Slovaks | 34.1 /100 | #187 | Fair 13.7% |
| Immigrants | Eritrea | 32.7 /100 | #188 | Fair 13.7% |
| Finns | 32.5 /100 | #189 | Fair 13.7% |
| Dutch | 29.7 /100 | #190 | Fair 13.8% |