Immigrants from Peru vs Immigrants from Yemen Female Poverty Among 25-34 Year Olds
COMPARE
Immigrants from Peru
Immigrants from Yemen
Female Poverty Among 25-34 Year Olds
Female Poverty Among 25-34 Year Olds Comparison
Immigrants from Peru
Immigrants from Yemen
12.7%
FEMALE POVERTY AMONG 25-34 YEAR OLDS
94.3/ 100
METRIC RATING
109th/ 347
METRIC RANK
19.8%
FEMALE POVERTY AMONG 25-34 YEAR OLDS
0.0/ 100
METRIC RATING
332nd/ 347
METRIC RANK
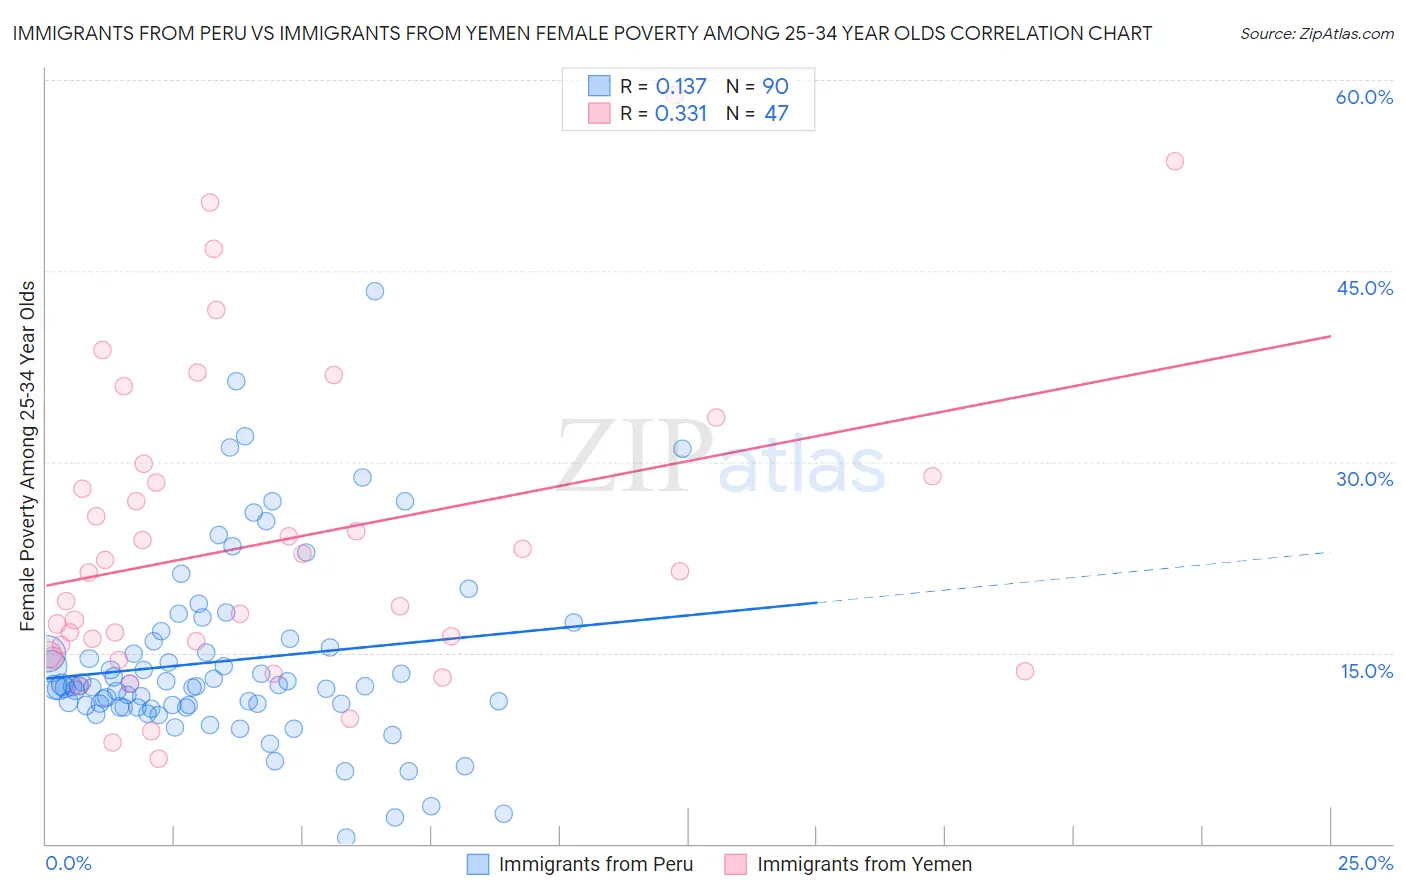
Immigrants from Peru vs Immigrants from Yemen Female Poverty Among 25-34 Year Olds Correlation Chart
The statistical analysis conducted on geographies consisting of 325,150,333 people shows a poor positive correlation between the proportion of Immigrants from Peru and poverty level among females between the ages 25 and 34 in the United States with a correlation coefficient (R) of 0.137 and weighted average of 12.7%. Similarly, the statistical analysis conducted on geographies consisting of 82,247,545 people shows a mild positive correlation between the proportion of Immigrants from Yemen and poverty level among females between the ages 25 and 34 in the United States with a correlation coefficient (R) of 0.331 and weighted average of 19.8%, a difference of 55.2%.
Female Poverty Among 25-34 Year Olds Correlation Summary
| Measurement | Immigrants from Peru | Immigrants from Yemen |
| Minimum | 0.53% | 6.7% |
| Maximum | 43.4% | 58.8% |
| Range | 42.9% | 52.2% |
| Mean | 14.4% | 23.7% |
| Median | 12.4% | 21.3% |
| Interquartile 25% (IQ1) | 10.9% | 14.9% |
| Interquartile 75% (IQ3) | 15.9% | 28.9% |
| Interquartile Range (IQR) | 5.0% | 14.0% |
| Standard Deviation (Sample) | 7.3% | 12.3% |
| Standard Deviation (Population) | 7.3% | 12.1% |
Similar Demographics by Female Poverty Among 25-34 Year Olds
Demographics Similar to Immigrants from Peru by Female Poverty Among 25-34 Year Olds
In terms of female poverty among 25-34 year olds, the demographic groups most similar to Immigrants from Peru are Immigrants from Norway (12.7%, a difference of 0.030%), Australian (12.8%, a difference of 0.080%), Danish (12.8%, a difference of 0.15%), Immigrants from Morocco (12.8%, a difference of 0.17%), and Immigrants from Syria (12.8%, a difference of 0.20%).
| Demographics | Rating | Rank | Female Poverty Among 25-34 Year Olds |
| Peruvians | 95.6 /100 | #102 | Exceptional 12.7% |
| Immigrants | Spain | 95.5 /100 | #103 | Exceptional 12.7% |
| Swedes | 95.4 /100 | #104 | Exceptional 12.7% |
| Immigrants | South Africa | 95.3 /100 | #105 | Exceptional 12.7% |
| Tsimshian | 95.1 /100 | #106 | Exceptional 12.7% |
| Poles | 94.9 /100 | #107 | Exceptional 12.7% |
| Immigrants | Norway | 94.4 /100 | #108 | Exceptional 12.7% |
| Immigrants | Peru | 94.3 /100 | #109 | Exceptional 12.7% |
| Australians | 94.1 /100 | #110 | Exceptional 12.8% |
| Danes | 93.9 /100 | #111 | Exceptional 12.8% |
| Immigrants | Morocco | 93.9 /100 | #112 | Exceptional 12.8% |
| Immigrants | Syria | 93.8 /100 | #113 | Exceptional 12.8% |
| Immigrants | Southern Europe | 93.6 /100 | #114 | Exceptional 12.8% |
| Immigrants | Brazil | 93.3 /100 | #115 | Exceptional 12.8% |
| Chileans | 93.2 /100 | #116 | Exceptional 12.8% |
Demographics Similar to Immigrants from Yemen by Female Poverty Among 25-34 Year Olds
In terms of female poverty among 25-34 year olds, the demographic groups most similar to Immigrants from Yemen are Kiowa (19.7%, a difference of 0.59%), Cajun (19.9%, a difference of 0.80%), Paiute (19.6%, a difference of 1.0%), Apache (20.1%, a difference of 1.5%), and Native/Alaskan (20.3%, a difference of 2.6%).
| Demographics | Rating | Rank | Female Poverty Among 25-34 Year Olds |
| Inupiat | 0.0 /100 | #325 | Tragic 18.5% |
| Blacks/African Americans | 0.0 /100 | #326 | Tragic 18.9% |
| Cheyenne | 0.0 /100 | #327 | Tragic 19.1% |
| Alaskan Athabascans | 0.0 /100 | #328 | Tragic 19.1% |
| Creek | 0.0 /100 | #329 | Tragic 19.2% |
| Paiute | 0.0 /100 | #330 | Tragic 19.6% |
| Kiowa | 0.0 /100 | #331 | Tragic 19.7% |
| Immigrants | Yemen | 0.0 /100 | #332 | Tragic 19.8% |
| Cajuns | 0.0 /100 | #333 | Tragic 19.9% |
| Apache | 0.0 /100 | #334 | Tragic 20.1% |
| Natives/Alaskans | 0.0 /100 | #335 | Tragic 20.3% |
| Pueblo | 0.0 /100 | #336 | Tragic 22.2% |
| Crow | 0.0 /100 | #337 | Tragic 22.7% |
| Houma | 0.0 /100 | #338 | Tragic 22.7% |
| Yuman | 0.0 /100 | #339 | Tragic 22.9% |