Immigrants from Peru vs Immigrants from Asia Female Poverty Among 25-34 Year Olds
COMPARE
Immigrants from Peru
Immigrants from Asia
Female Poverty Among 25-34 Year Olds
Female Poverty Among 25-34 Year Olds Comparison
Immigrants from Peru
Immigrants from Asia
12.7%
FEMALE POVERTY AMONG 25-34 YEAR OLDS
94.3/ 100
METRIC RATING
109th/ 347
METRIC RANK
11.6%
FEMALE POVERTY AMONG 25-34 YEAR OLDS
99.9/ 100
METRIC RATING
32nd/ 347
METRIC RANK
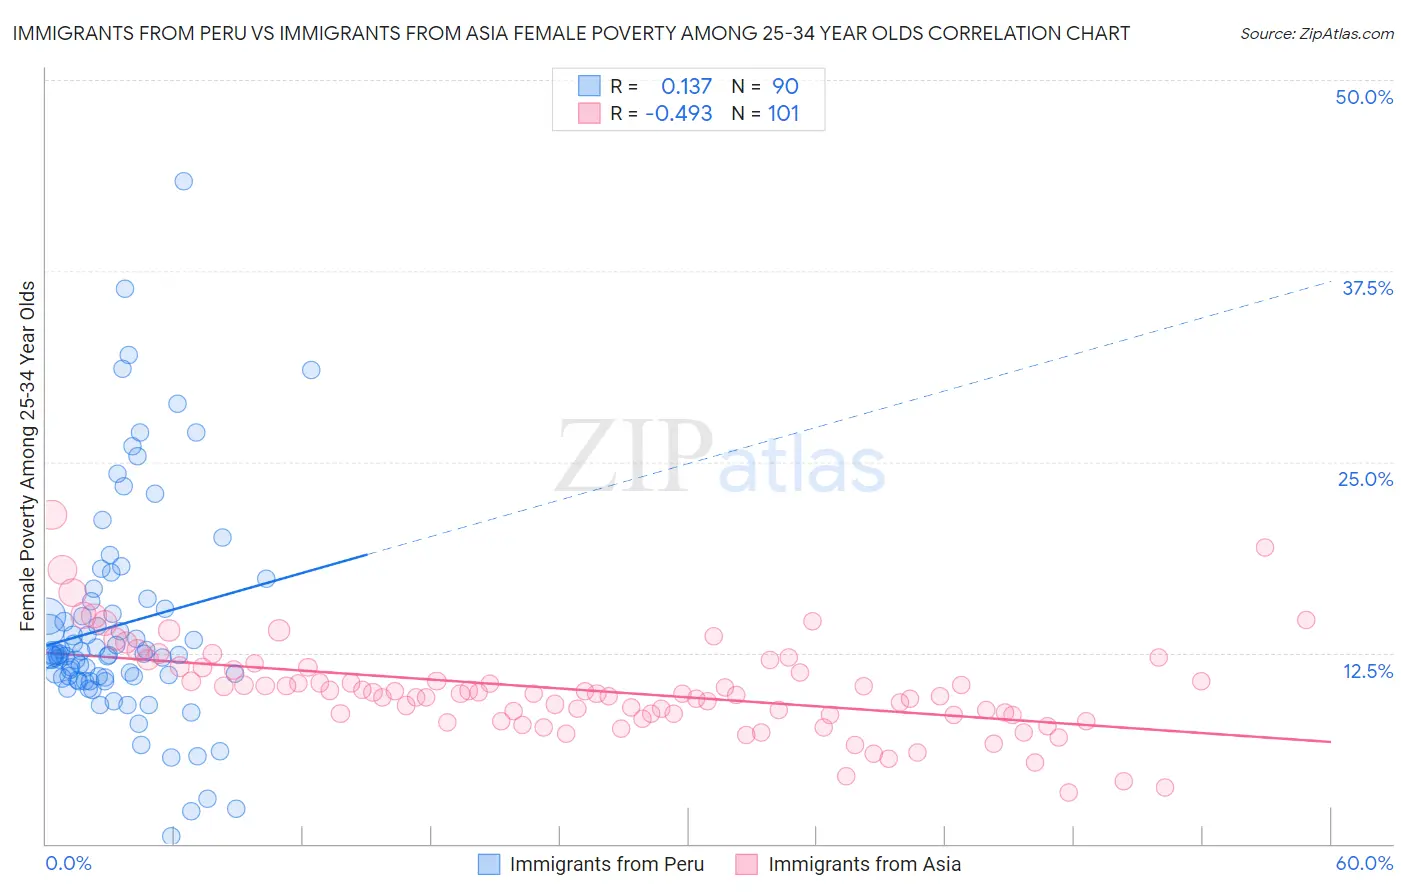
Immigrants from Peru vs Immigrants from Asia Female Poverty Among 25-34 Year Olds Correlation Chart
The statistical analysis conducted on geographies consisting of 325,150,333 people shows a poor positive correlation between the proportion of Immigrants from Peru and poverty level among females between the ages 25 and 34 in the United States with a correlation coefficient (R) of 0.137 and weighted average of 12.7%. Similarly, the statistical analysis conducted on geographies consisting of 531,620,237 people shows a moderate negative correlation between the proportion of Immigrants from Asia and poverty level among females between the ages 25 and 34 in the United States with a correlation coefficient (R) of -0.493 and weighted average of 11.6%, a difference of 9.9%.
Female Poverty Among 25-34 Year Olds Correlation Summary
| Measurement | Immigrants from Peru | Immigrants from Asia |
| Minimum | 0.53% | 3.3% |
| Maximum | 43.4% | 21.5% |
| Range | 42.9% | 18.2% |
| Mean | 14.4% | 10.0% |
| Median | 12.4% | 9.8% |
| Interquartile 25% (IQ1) | 10.9% | 8.4% |
| Interquartile 75% (IQ3) | 15.9% | 11.4% |
| Interquartile Range (IQR) | 5.0% | 3.0% |
| Standard Deviation (Sample) | 7.3% | 3.0% |
| Standard Deviation (Population) | 7.3% | 3.0% |
Similar Demographics by Female Poverty Among 25-34 Year Olds
Demographics Similar to Immigrants from Peru by Female Poverty Among 25-34 Year Olds
In terms of female poverty among 25-34 year olds, the demographic groups most similar to Immigrants from Peru are Immigrants from Norway (12.7%, a difference of 0.030%), Australian (12.8%, a difference of 0.080%), Danish (12.8%, a difference of 0.15%), Immigrants from Morocco (12.8%, a difference of 0.17%), and Immigrants from Syria (12.8%, a difference of 0.20%).
| Demographics | Rating | Rank | Female Poverty Among 25-34 Year Olds |
| Peruvians | 95.6 /100 | #102 | Exceptional 12.7% |
| Immigrants | Spain | 95.5 /100 | #103 | Exceptional 12.7% |
| Swedes | 95.4 /100 | #104 | Exceptional 12.7% |
| Immigrants | South Africa | 95.3 /100 | #105 | Exceptional 12.7% |
| Tsimshian | 95.1 /100 | #106 | Exceptional 12.7% |
| Poles | 94.9 /100 | #107 | Exceptional 12.7% |
| Immigrants | Norway | 94.4 /100 | #108 | Exceptional 12.7% |
| Immigrants | Peru | 94.3 /100 | #109 | Exceptional 12.7% |
| Australians | 94.1 /100 | #110 | Exceptional 12.8% |
| Danes | 93.9 /100 | #111 | Exceptional 12.8% |
| Immigrants | Morocco | 93.9 /100 | #112 | Exceptional 12.8% |
| Immigrants | Syria | 93.8 /100 | #113 | Exceptional 12.8% |
| Immigrants | Southern Europe | 93.6 /100 | #114 | Exceptional 12.8% |
| Immigrants | Brazil | 93.3 /100 | #115 | Exceptional 12.8% |
| Chileans | 93.2 /100 | #116 | Exceptional 12.8% |
Demographics Similar to Immigrants from Asia by Female Poverty Among 25-34 Year Olds
In terms of female poverty among 25-34 year olds, the demographic groups most similar to Immigrants from Asia are Immigrants from Japan (11.6%, a difference of 0.30%), Immigrants from Poland (11.6%, a difference of 0.35%), Zimbabwean (11.7%, a difference of 0.57%), Cypriot (11.5%, a difference of 0.59%), and Immigrants from Pakistan (11.5%, a difference of 0.62%).
| Demographics | Rating | Rank | Female Poverty Among 25-34 Year Olds |
| Bhutanese | 99.9 /100 | #25 | Exceptional 11.4% |
| Tongans | 99.9 /100 | #26 | Exceptional 11.5% |
| Immigrants | Greece | 99.9 /100 | #27 | Exceptional 11.5% |
| Immigrants | Pakistan | 99.9 /100 | #28 | Exceptional 11.5% |
| Bulgarians | 99.9 /100 | #29 | Exceptional 11.5% |
| Cypriots | 99.9 /100 | #30 | Exceptional 11.5% |
| Immigrants | Japan | 99.9 /100 | #31 | Exceptional 11.6% |
| Immigrants | Asia | 99.9 /100 | #32 | Exceptional 11.6% |
| Immigrants | Poland | 99.9 /100 | #33 | Exceptional 11.6% |
| Zimbabweans | 99.9 /100 | #34 | Exceptional 11.7% |
| Cambodians | 99.9 /100 | #35 | Exceptional 11.7% |
| Immigrants | Sri Lanka | 99.8 /100 | #36 | Exceptional 11.8% |
| Taiwanese | 99.8 /100 | #37 | Exceptional 11.8% |
| Immigrants | North Macedonia | 99.8 /100 | #38 | Exceptional 11.8% |
| Latvians | 99.8 /100 | #39 | Exceptional 11.8% |