Immigrants from Peru vs Italian Female Poverty Among 25-34 Year Olds
COMPARE
Immigrants from Peru
Italian
Female Poverty Among 25-34 Year Olds
Female Poverty Among 25-34 Year Olds Comparison
Immigrants from Peru
Italians
12.7%
FEMALE POVERTY AMONG 25-34 YEAR OLDS
94.3/ 100
METRIC RATING
109th/ 347
METRIC RANK
12.5%
FEMALE POVERTY AMONG 25-34 YEAR OLDS
97.2/ 100
METRIC RATING
89th/ 347
METRIC RANK
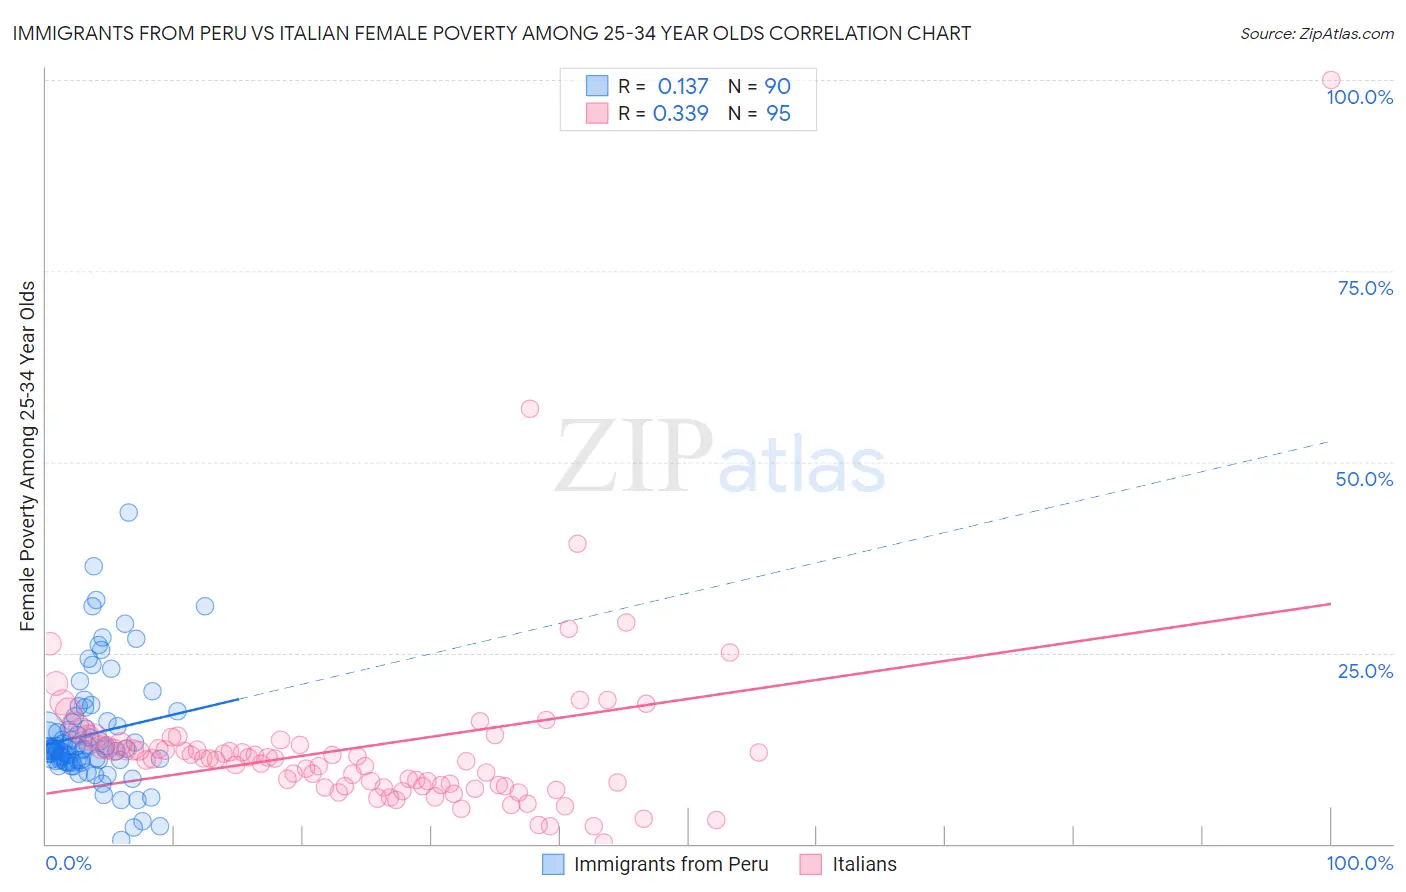
Immigrants from Peru vs Italian Female Poverty Among 25-34 Year Olds Correlation Chart
The statistical analysis conducted on geographies consisting of 325,150,333 people shows a poor positive correlation between the proportion of Immigrants from Peru and poverty level among females between the ages 25 and 34 in the United States with a correlation coefficient (R) of 0.137 and weighted average of 12.7%. Similarly, the statistical analysis conducted on geographies consisting of 551,961,209 people shows a mild positive correlation between the proportion of Italians and poverty level among females between the ages 25 and 34 in the United States with a correlation coefficient (R) of 0.339 and weighted average of 12.5%, a difference of 1.7%.
Female Poverty Among 25-34 Year Olds Correlation Summary
| Measurement | Immigrants from Peru | Italian |
| Minimum | 0.53% | 0.18% |
| Maximum | 43.4% | 100.0% |
| Range | 42.9% | 99.8% |
| Mean | 14.4% | 12.7% |
| Median | 12.4% | 11.1% |
| Interquartile 25% (IQ1) | 10.9% | 7.5% |
| Interquartile 75% (IQ3) | 15.9% | 13.1% |
| Interquartile Range (IQR) | 5.0% | 5.5% |
| Standard Deviation (Sample) | 7.3% | 11.8% |
| Standard Deviation (Population) | 7.3% | 11.8% |
Demographics Similar to Immigrants from Peru and Italians by Female Poverty Among 25-34 Year Olds
In terms of female poverty among 25-34 year olds, the demographic groups most similar to Immigrants from Peru are Immigrants from Norway (12.7%, a difference of 0.030%), Polish (12.7%, a difference of 0.28%), Tsimshian (12.7%, a difference of 0.33%), Immigrants from South Africa (12.7%, a difference of 0.43%), and Swedish (12.7%, a difference of 0.48%). Similarly, the demographic groups most similar to Italians are Immigrants from Albania (12.5%, a difference of 0.15%), Norwegian (12.6%, a difference of 0.25%), Immigrants from Armenia (12.6%, a difference of 0.27%), Palestinian (12.6%, a difference of 0.30%), and Immigrants from France (12.6%, a difference of 0.35%).
| Demographics | Rating | Rank | Female Poverty Among 25-34 Year Olds |
| Italians | 97.2 /100 | #89 | Exceptional 12.5% |
| Immigrants | Albania | 97.1 /100 | #90 | Exceptional 12.5% |
| Norwegians | 96.9 /100 | #91 | Exceptional 12.6% |
| Immigrants | Armenia | 96.9 /100 | #92 | Exceptional 12.6% |
| Palestinians | 96.9 /100 | #93 | Exceptional 12.6% |
| Immigrants | France | 96.8 /100 | #94 | Exceptional 12.6% |
| Ukrainians | 96.7 /100 | #95 | Exceptional 12.6% |
| Immigrants | Zimbabwe | 96.7 /100 | #96 | Exceptional 12.6% |
| Immigrants | Northern Africa | 96.6 /100 | #97 | Exceptional 12.6% |
| Immigrants | Ethiopia | 96.5 /100 | #98 | Exceptional 12.6% |
| Immigrants | Argentina | 96.4 /100 | #99 | Exceptional 12.6% |
| Immigrants | Denmark | 95.7 /100 | #100 | Exceptional 12.7% |
| Immigrants | Switzerland | 95.7 /100 | #101 | Exceptional 12.7% |
| Peruvians | 95.6 /100 | #102 | Exceptional 12.7% |
| Immigrants | Spain | 95.5 /100 | #103 | Exceptional 12.7% |
| Swedes | 95.4 /100 | #104 | Exceptional 12.7% |
| Immigrants | South Africa | 95.3 /100 | #105 | Exceptional 12.7% |
| Tsimshian | 95.1 /100 | #106 | Exceptional 12.7% |
| Poles | 94.9 /100 | #107 | Exceptional 12.7% |
| Immigrants | Norway | 94.4 /100 | #108 | Exceptional 12.7% |
| Immigrants | Peru | 94.3 /100 | #109 | Exceptional 12.7% |