Immigrants from Asia vs Portuguese Female Poverty Among 25-34 Year Olds
COMPARE
Immigrants from Asia
Portuguese
Female Poverty Among 25-34 Year Olds
Female Poverty Among 25-34 Year Olds Comparison
Immigrants from Asia
Portuguese
11.6%
FEMALE POVERTY AMONG 25-34 YEAR OLDS
99.9/ 100
METRIC RATING
32nd/ 347
METRIC RANK
13.6%
FEMALE POVERTY AMONG 25-34 YEAR OLDS
40.3/ 100
METRIC RATING
183rd/ 347
METRIC RANK
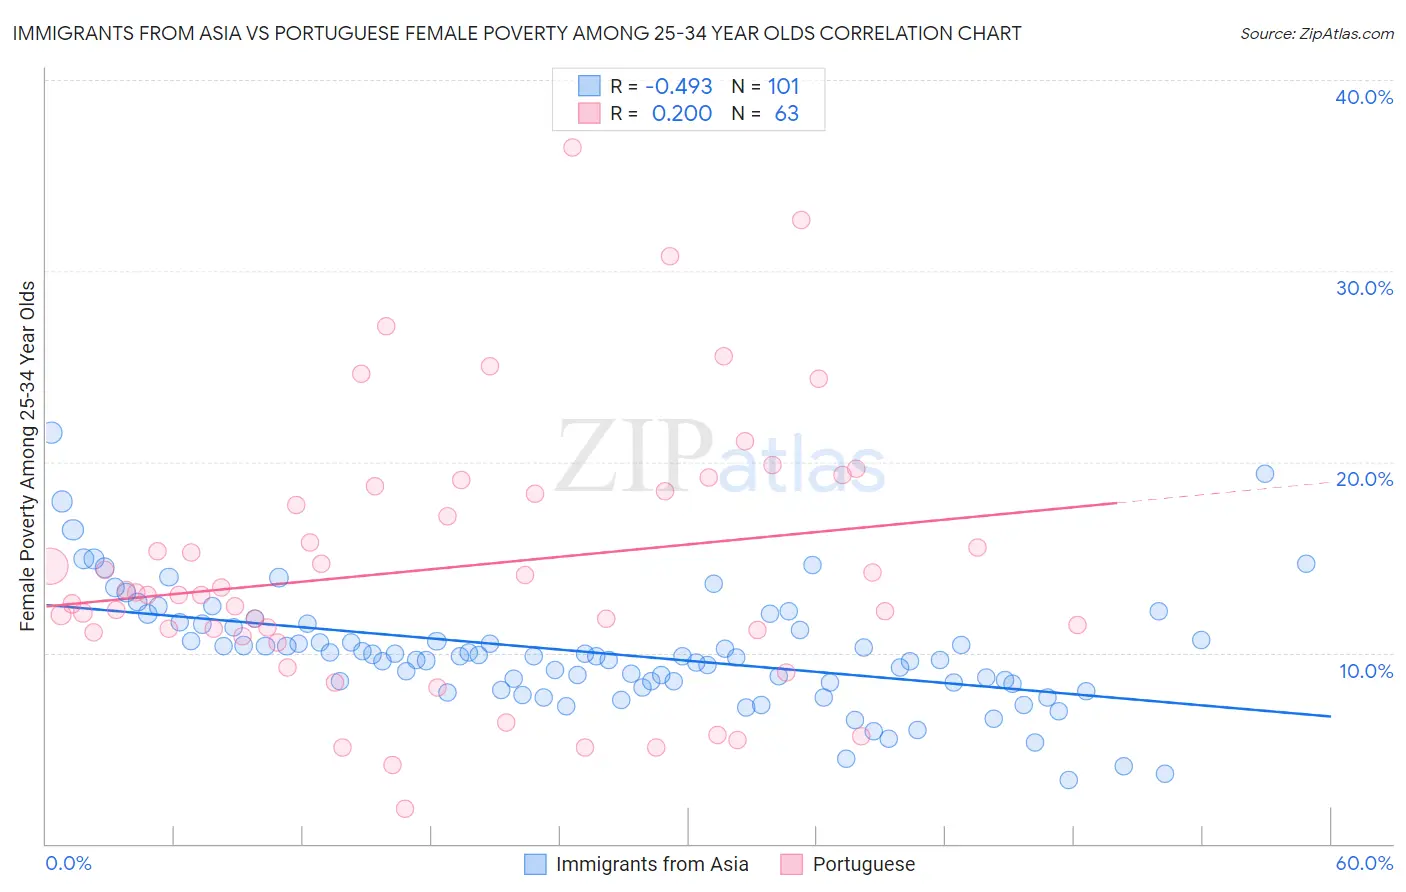
Immigrants from Asia vs Portuguese Female Poverty Among 25-34 Year Olds Correlation Chart
The statistical analysis conducted on geographies consisting of 531,620,237 people shows a moderate negative correlation between the proportion of Immigrants from Asia and poverty level among females between the ages 25 and 34 in the United States with a correlation coefficient (R) of -0.493 and weighted average of 11.6%. Similarly, the statistical analysis conducted on geographies consisting of 439,781,405 people shows a weak positive correlation between the proportion of Portuguese and poverty level among females between the ages 25 and 34 in the United States with a correlation coefficient (R) of 0.200 and weighted average of 13.6%, a difference of 17.6%.
Female Poverty Among 25-34 Year Olds Correlation Summary
| Measurement | Immigrants from Asia | Portuguese |
| Minimum | 3.3% | 1.8% |
| Maximum | 21.5% | 36.4% |
| Range | 18.2% | 34.6% |
| Mean | 10.0% | 14.5% |
| Median | 9.8% | 13.0% |
| Interquartile 25% (IQ1) | 8.4% | 11.1% |
| Interquartile 75% (IQ3) | 11.4% | 18.5% |
| Interquartile Range (IQR) | 3.0% | 7.4% |
| Standard Deviation (Sample) | 3.0% | 7.0% |
| Standard Deviation (Population) | 3.0% | 6.9% |
Similar Demographics by Female Poverty Among 25-34 Year Olds
Demographics Similar to Immigrants from Asia by Female Poverty Among 25-34 Year Olds
In terms of female poverty among 25-34 year olds, the demographic groups most similar to Immigrants from Asia are Immigrants from Japan (11.6%, a difference of 0.30%), Immigrants from Poland (11.6%, a difference of 0.35%), Zimbabwean (11.7%, a difference of 0.57%), Cypriot (11.5%, a difference of 0.59%), and Immigrants from Pakistan (11.5%, a difference of 0.62%).
| Demographics | Rating | Rank | Female Poverty Among 25-34 Year Olds |
| Bhutanese | 99.9 /100 | #25 | Exceptional 11.4% |
| Tongans | 99.9 /100 | #26 | Exceptional 11.5% |
| Immigrants | Greece | 99.9 /100 | #27 | Exceptional 11.5% |
| Immigrants | Pakistan | 99.9 /100 | #28 | Exceptional 11.5% |
| Bulgarians | 99.9 /100 | #29 | Exceptional 11.5% |
| Cypriots | 99.9 /100 | #30 | Exceptional 11.5% |
| Immigrants | Japan | 99.9 /100 | #31 | Exceptional 11.6% |
| Immigrants | Asia | 99.9 /100 | #32 | Exceptional 11.6% |
| Immigrants | Poland | 99.9 /100 | #33 | Exceptional 11.6% |
| Zimbabweans | 99.9 /100 | #34 | Exceptional 11.7% |
| Cambodians | 99.9 /100 | #35 | Exceptional 11.7% |
| Immigrants | Sri Lanka | 99.8 /100 | #36 | Exceptional 11.8% |
| Taiwanese | 99.8 /100 | #37 | Exceptional 11.8% |
| Immigrants | North Macedonia | 99.8 /100 | #38 | Exceptional 11.8% |
| Latvians | 99.8 /100 | #39 | Exceptional 11.8% |
Demographics Similar to Portuguese by Female Poverty Among 25-34 Year Olds
In terms of female poverty among 25-34 year olds, the demographic groups most similar to Portuguese are Immigrants from Venezuela (13.6%, a difference of 0.030%), Guamanian/Chamorro (13.6%, a difference of 0.10%), German (13.6%, a difference of 0.11%), Immigrants from Eastern Africa (13.6%, a difference of 0.28%), and Czechoslovakian (13.7%, a difference of 0.31%).
| Demographics | Rating | Rank | Female Poverty Among 25-34 Year Olds |
| Yugoslavians | 45.0 /100 | #176 | Average 13.6% |
| Venezuelans | 44.6 /100 | #177 | Average 13.6% |
| Canadians | 44.3 /100 | #178 | Average 13.6% |
| Immigrants | Eastern Africa | 43.6 /100 | #179 | Average 13.6% |
| Germans | 41.6 /100 | #180 | Average 13.6% |
| Guamanians/Chamorros | 41.5 /100 | #181 | Average 13.6% |
| Immigrants | Venezuela | 40.7 /100 | #182 | Average 13.6% |
| Portuguese | 40.3 /100 | #183 | Average 13.6% |
| Czechoslovakians | 36.8 /100 | #184 | Fair 13.7% |
| Irish | 35.3 /100 | #185 | Fair 13.7% |
| Immigrants | Uruguay | 34.1 /100 | #186 | Fair 13.7% |
| Slovaks | 34.1 /100 | #187 | Fair 13.7% |
| Immigrants | Eritrea | 32.7 /100 | #188 | Fair 13.7% |
| Finns | 32.5 /100 | #189 | Fair 13.7% |
| Dutch | 29.7 /100 | #190 | Fair 13.8% |