German Russian vs Portuguese Female Poverty Among 25-34 Year Olds
COMPARE
German Russian
Portuguese
Female Poverty Among 25-34 Year Olds
Female Poverty Among 25-34 Year Olds Comparison
German Russians
Portuguese
14.9%
FEMALE POVERTY AMONG 25-34 YEAR OLDS
0.8/ 100
METRIC RATING
247th/ 347
METRIC RANK
13.6%
FEMALE POVERTY AMONG 25-34 YEAR OLDS
40.3/ 100
METRIC RATING
183rd/ 347
METRIC RANK
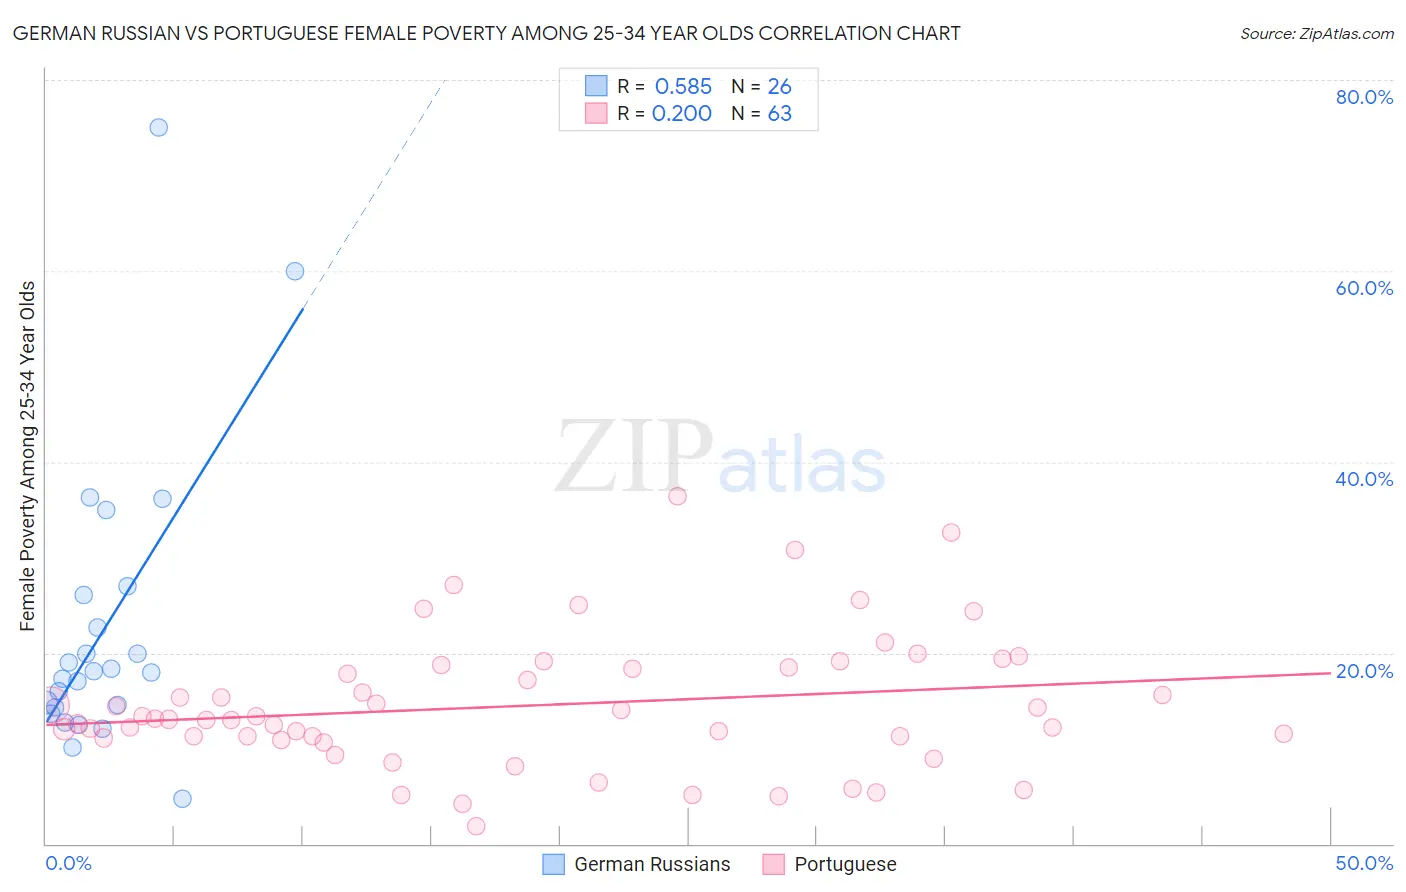
German Russian vs Portuguese Female Poverty Among 25-34 Year Olds Correlation Chart
The statistical analysis conducted on geographies consisting of 96,128,428 people shows a substantial positive correlation between the proportion of German Russians and poverty level among females between the ages 25 and 34 in the United States with a correlation coefficient (R) of 0.585 and weighted average of 14.9%. Similarly, the statistical analysis conducted on geographies consisting of 439,781,405 people shows a weak positive correlation between the proportion of Portuguese and poverty level among females between the ages 25 and 34 in the United States with a correlation coefficient (R) of 0.200 and weighted average of 13.6%, a difference of 9.0%.
Female Poverty Among 25-34 Year Olds Correlation Summary
| Measurement | German Russian | Portuguese |
| Minimum | 4.7% | 1.8% |
| Maximum | 75.0% | 36.4% |
| Range | 70.3% | 34.6% |
| Mean | 22.7% | 14.5% |
| Median | 18.0% | 13.0% |
| Interquartile 25% (IQ1) | 14.3% | 11.1% |
| Interquartile 75% (IQ3) | 26.1% | 18.5% |
| Interquartile Range (IQR) | 11.8% | 7.4% |
| Standard Deviation (Sample) | 15.4% | 7.0% |
| Standard Deviation (Population) | 15.1% | 6.9% |
Similar Demographics by Female Poverty Among 25-34 Year Olds
Demographics Similar to German Russians by Female Poverty Among 25-34 Year Olds
In terms of female poverty among 25-34 year olds, the demographic groups most similar to German Russians are Immigrants from Western Africa (14.9%, a difference of 0.040%), Jamaican (14.8%, a difference of 0.34%), Immigrants from Middle Africa (14.8%, a difference of 0.38%), Immigrants from Bangladesh (14.8%, a difference of 0.56%), and Immigrants from Nicaragua (14.8%, a difference of 0.57%).
| Demographics | Rating | Rank | Female Poverty Among 25-34 Year Olds |
| Immigrants | Grenada | 1.3 /100 | #240 | Tragic 14.7% |
| Scotch-Irish | 1.2 /100 | #241 | Tragic 14.8% |
| Barbadians | 1.2 /100 | #242 | Tragic 14.8% |
| Immigrants | Nicaragua | 1.1 /100 | #243 | Tragic 14.8% |
| Immigrants | Bangladesh | 1.1 /100 | #244 | Tragic 14.8% |
| Immigrants | Middle Africa | 1.0 /100 | #245 | Tragic 14.8% |
| Jamaicans | 1.0 /100 | #246 | Tragic 14.8% |
| German Russians | 0.8 /100 | #247 | Tragic 14.9% |
| Immigrants | Western Africa | 0.8 /100 | #248 | Tragic 14.9% |
| Immigrants | Haiti | 0.5 /100 | #249 | Tragic 15.0% |
| Immigrants | El Salvador | 0.5 /100 | #250 | Tragic 15.0% |
| Haitians | 0.5 /100 | #251 | Tragic 15.0% |
| Belizeans | 0.4 /100 | #252 | Tragic 15.1% |
| Immigrants | West Indies | 0.4 /100 | #253 | Tragic 15.1% |
| Somalis | 0.4 /100 | #254 | Tragic 15.1% |
Demographics Similar to Portuguese by Female Poverty Among 25-34 Year Olds
In terms of female poverty among 25-34 year olds, the demographic groups most similar to Portuguese are Immigrants from Venezuela (13.6%, a difference of 0.030%), Guamanian/Chamorro (13.6%, a difference of 0.10%), German (13.6%, a difference of 0.11%), Immigrants from Eastern Africa (13.6%, a difference of 0.28%), and Czechoslovakian (13.7%, a difference of 0.31%).
| Demographics | Rating | Rank | Female Poverty Among 25-34 Year Olds |
| Yugoslavians | 45.0 /100 | #176 | Average 13.6% |
| Venezuelans | 44.6 /100 | #177 | Average 13.6% |
| Canadians | 44.3 /100 | #178 | Average 13.6% |
| Immigrants | Eastern Africa | 43.6 /100 | #179 | Average 13.6% |
| Germans | 41.6 /100 | #180 | Average 13.6% |
| Guamanians/Chamorros | 41.5 /100 | #181 | Average 13.6% |
| Immigrants | Venezuela | 40.7 /100 | #182 | Average 13.6% |
| Portuguese | 40.3 /100 | #183 | Average 13.6% |
| Czechoslovakians | 36.8 /100 | #184 | Fair 13.7% |
| Irish | 35.3 /100 | #185 | Fair 13.7% |
| Immigrants | Uruguay | 34.1 /100 | #186 | Fair 13.7% |
| Slovaks | 34.1 /100 | #187 | Fair 13.7% |
| Immigrants | Eritrea | 32.7 /100 | #188 | Fair 13.7% |
| Finns | 32.5 /100 | #189 | Fair 13.7% |
| Dutch | 29.7 /100 | #190 | Fair 13.8% |