Immigrants from Peru vs Sierra Leonean Female Poverty Among 25-34 Year Olds
COMPARE
Immigrants from Peru
Sierra Leonean
Female Poverty Among 25-34 Year Olds
Female Poverty Among 25-34 Year Olds Comparison
Immigrants from Peru
Sierra Leoneans
12.7%
FEMALE POVERTY AMONG 25-34 YEAR OLDS
94.3/ 100
METRIC RATING
109th/ 347
METRIC RANK
13.2%
FEMALE POVERTY AMONG 25-34 YEAR OLDS
76.3/ 100
METRIC RATING
149th/ 347
METRIC RANK
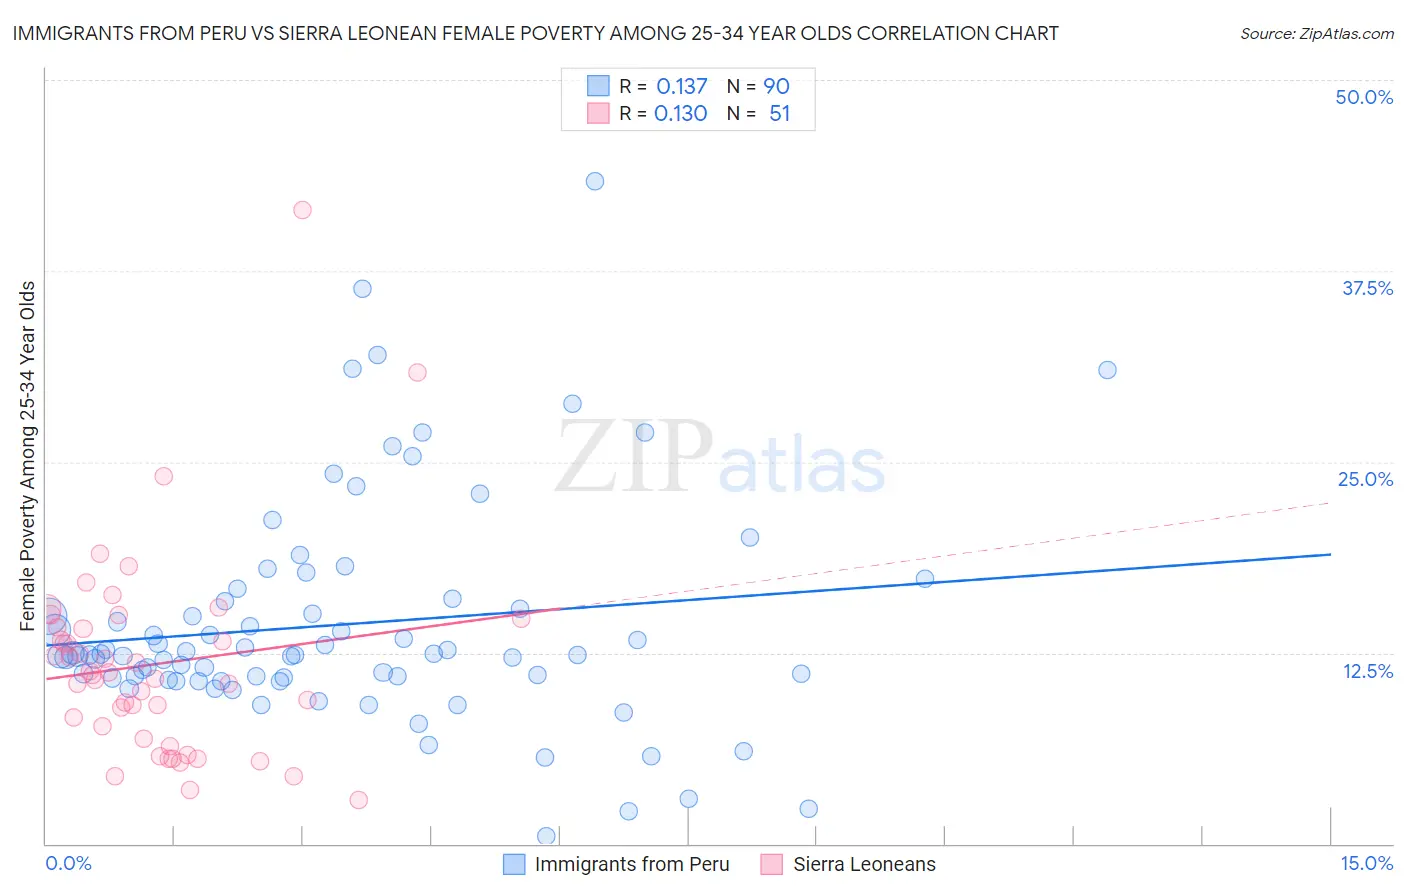
Immigrants from Peru vs Sierra Leonean Female Poverty Among 25-34 Year Olds Correlation Chart
The statistical analysis conducted on geographies consisting of 325,150,333 people shows a poor positive correlation between the proportion of Immigrants from Peru and poverty level among females between the ages 25 and 34 in the United States with a correlation coefficient (R) of 0.137 and weighted average of 12.7%. Similarly, the statistical analysis conducted on geographies consisting of 83,152,605 people shows a poor positive correlation between the proportion of Sierra Leoneans and poverty level among females between the ages 25 and 34 in the United States with a correlation coefficient (R) of 0.130 and weighted average of 13.2%, a difference of 3.6%.
Female Poverty Among 25-34 Year Olds Correlation Summary
| Measurement | Immigrants from Peru | Sierra Leonean |
| Minimum | 0.53% | 2.8% |
| Maximum | 43.4% | 41.5% |
| Range | 42.9% | 38.6% |
| Mean | 14.4% | 11.8% |
| Median | 12.4% | 11.0% |
| Interquartile 25% (IQ1) | 10.9% | 6.9% |
| Interquartile 75% (IQ3) | 15.9% | 14.2% |
| Interquartile Range (IQR) | 5.0% | 7.3% |
| Standard Deviation (Sample) | 7.3% | 6.7% |
| Standard Deviation (Population) | 7.3% | 6.7% |
Similar Demographics by Female Poverty Among 25-34 Year Olds
Demographics Similar to Immigrants from Peru by Female Poverty Among 25-34 Year Olds
In terms of female poverty among 25-34 year olds, the demographic groups most similar to Immigrants from Peru are Immigrants from Norway (12.7%, a difference of 0.030%), Australian (12.8%, a difference of 0.080%), Danish (12.8%, a difference of 0.15%), Immigrants from Morocco (12.8%, a difference of 0.17%), and Immigrants from Syria (12.8%, a difference of 0.20%).
| Demographics | Rating | Rank | Female Poverty Among 25-34 Year Olds |
| Peruvians | 95.6 /100 | #102 | Exceptional 12.7% |
| Immigrants | Spain | 95.5 /100 | #103 | Exceptional 12.7% |
| Swedes | 95.4 /100 | #104 | Exceptional 12.7% |
| Immigrants | South Africa | 95.3 /100 | #105 | Exceptional 12.7% |
| Tsimshian | 95.1 /100 | #106 | Exceptional 12.7% |
| Poles | 94.9 /100 | #107 | Exceptional 12.7% |
| Immigrants | Norway | 94.4 /100 | #108 | Exceptional 12.7% |
| Immigrants | Peru | 94.3 /100 | #109 | Exceptional 12.7% |
| Australians | 94.1 /100 | #110 | Exceptional 12.8% |
| Danes | 93.9 /100 | #111 | Exceptional 12.8% |
| Immigrants | Morocco | 93.9 /100 | #112 | Exceptional 12.8% |
| Immigrants | Syria | 93.8 /100 | #113 | Exceptional 12.8% |
| Immigrants | Southern Europe | 93.6 /100 | #114 | Exceptional 12.8% |
| Immigrants | Brazil | 93.3 /100 | #115 | Exceptional 12.8% |
| Chileans | 93.2 /100 | #116 | Exceptional 12.8% |
Demographics Similar to Sierra Leoneans by Female Poverty Among 25-34 Year Olds
In terms of female poverty among 25-34 year olds, the demographic groups most similar to Sierra Leoneans are Iraqi (13.2%, a difference of 0.030%), Costa Rican (13.2%, a difference of 0.050%), Lebanese (13.2%, a difference of 0.060%), Slavic (13.2%, a difference of 0.060%), and European (13.2%, a difference of 0.070%).
| Demographics | Rating | Rank | Female Poverty Among 25-34 Year Olds |
| Scandinavians | 82.3 /100 | #142 | Excellent 13.1% |
| Israelis | 81.9 /100 | #143 | Excellent 13.1% |
| Native Hawaiians | 78.9 /100 | #144 | Good 13.2% |
| Colombians | 77.2 /100 | #145 | Good 13.2% |
| South Americans | 76.9 /100 | #146 | Good 13.2% |
| Europeans | 76.8 /100 | #147 | Good 13.2% |
| Lebanese | 76.8 /100 | #148 | Good 13.2% |
| Sierra Leoneans | 76.3 /100 | #149 | Good 13.2% |
| Iraqis | 76.0 /100 | #150 | Good 13.2% |
| Costa Ricans | 75.8 /100 | #151 | Good 13.2% |
| Slavs | 75.7 /100 | #152 | Good 13.2% |
| Northern Europeans | 73.7 /100 | #153 | Good 13.2% |
| Arabs | 73.5 /100 | #154 | Good 13.2% |
| Immigrants | Sierra Leone | 72.9 /100 | #155 | Good 13.3% |
| Immigrants | Cameroon | 72.0 /100 | #156 | Good 13.3% |