Burmese vs Italian Female Poverty Among 25-34 Year Olds
COMPARE
Burmese
Italian
Female Poverty Among 25-34 Year Olds
Female Poverty Among 25-34 Year Olds Comparison
Burmese
Italians
11.2%
FEMALE POVERTY AMONG 25-34 YEAR OLDS
100.0/ 100
METRIC RATING
13th/ 347
METRIC RANK
12.5%
FEMALE POVERTY AMONG 25-34 YEAR OLDS
97.2/ 100
METRIC RATING
89th/ 347
METRIC RANK
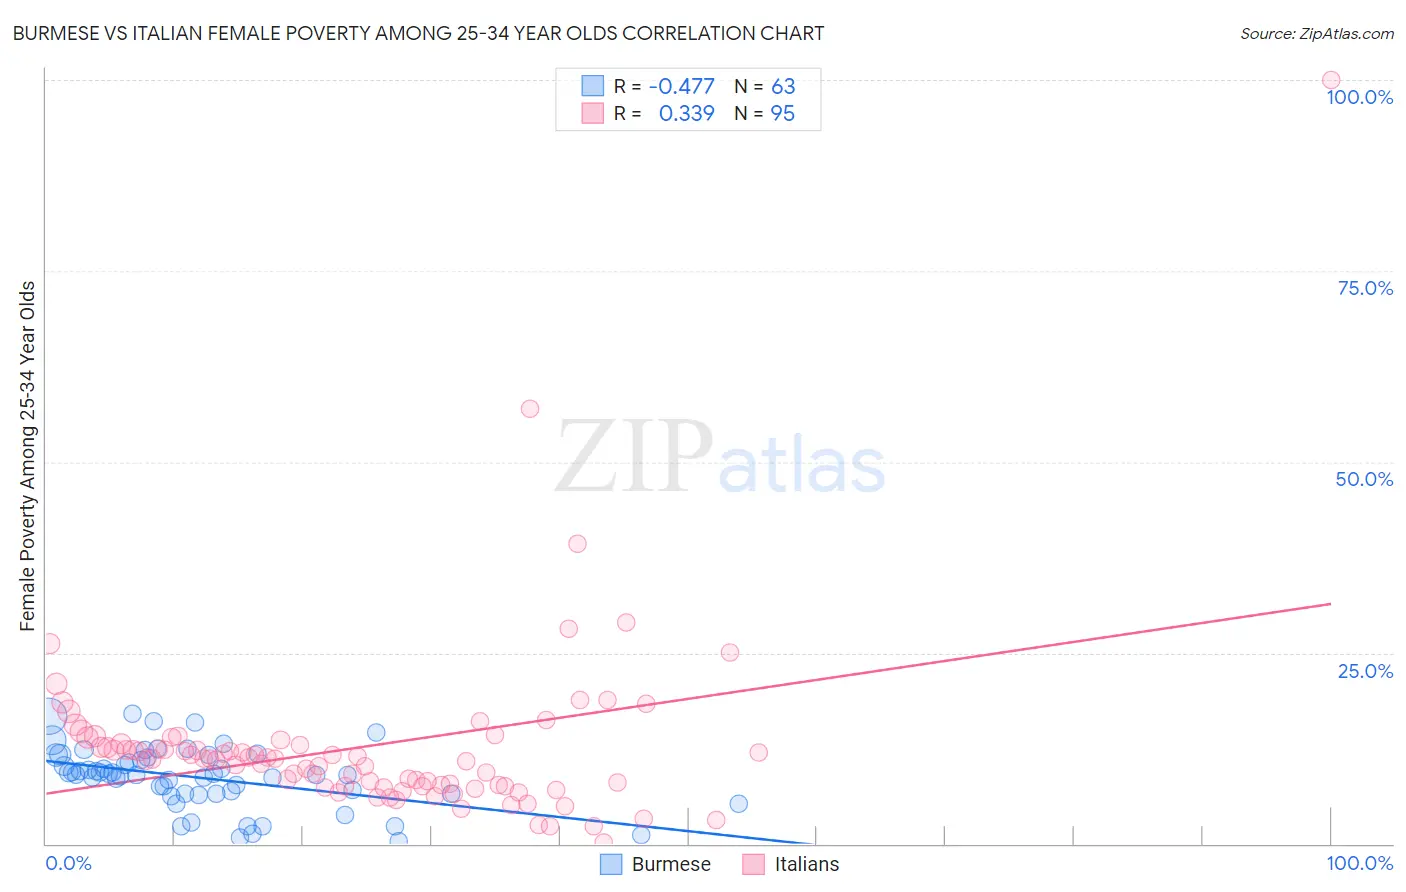
Burmese vs Italian Female Poverty Among 25-34 Year Olds Correlation Chart
The statistical analysis conducted on geographies consisting of 455,200,950 people shows a moderate negative correlation between the proportion of Burmese and poverty level among females between the ages 25 and 34 in the United States with a correlation coefficient (R) of -0.477 and weighted average of 11.2%. Similarly, the statistical analysis conducted on geographies consisting of 551,961,209 people shows a mild positive correlation between the proportion of Italians and poverty level among females between the ages 25 and 34 in the United States with a correlation coefficient (R) of 0.339 and weighted average of 12.5%, a difference of 12.1%.
Female Poverty Among 25-34 Year Olds Correlation Summary
| Measurement | Burmese | Italian |
| Minimum | 0.35% | 0.18% |
| Maximum | 17.0% | 100.0% |
| Range | 16.7% | 99.8% |
| Mean | 8.7% | 12.7% |
| Median | 9.1% | 11.1% |
| Interquartile 25% (IQ1) | 6.6% | 7.5% |
| Interquartile 75% (IQ3) | 11.3% | 13.1% |
| Interquartile Range (IQR) | 4.7% | 5.5% |
| Standard Deviation (Sample) | 3.9% | 11.8% |
| Standard Deviation (Population) | 3.9% | 11.8% |
Similar Demographics by Female Poverty Among 25-34 Year Olds
Demographics Similar to Burmese by Female Poverty Among 25-34 Year Olds
In terms of female poverty among 25-34 year olds, the demographic groups most similar to Burmese are Indian (Asian) (11.2%, a difference of 0.010%), Immigrants from Ireland (11.2%, a difference of 0.11%), Assyrian/Chaldean/Syriac (11.2%, a difference of 0.11%), Immigrants from Bolivia (11.2%, a difference of 0.15%), and Immigrants from China (11.2%, a difference of 0.22%).
| Demographics | Rating | Rank | Female Poverty Among 25-34 Year Olds |
| Immigrants | South Central Asia | 100.0 /100 | #6 | Exceptional 10.8% |
| Chinese | 100.0 /100 | #7 | Exceptional 11.0% |
| Immigrants | Iran | 100.0 /100 | #8 | Exceptional 11.0% |
| Immigrants | Singapore | 100.0 /100 | #9 | Exceptional 11.1% |
| Immigrants | Lithuania | 100.0 /100 | #10 | Exceptional 11.1% |
| Immigrants | Korea | 100.0 /100 | #11 | Exceptional 11.1% |
| Immigrants | Ireland | 100.0 /100 | #12 | Exceptional 11.2% |
| Burmese | 100.0 /100 | #13 | Exceptional 11.2% |
| Indians (Asian) | 100.0 /100 | #14 | Exceptional 11.2% |
| Assyrians/Chaldeans/Syriacs | 100.0 /100 | #15 | Exceptional 11.2% |
| Immigrants | Bolivia | 100.0 /100 | #16 | Exceptional 11.2% |
| Immigrants | China | 100.0 /100 | #17 | Exceptional 11.2% |
| Immigrants | Eastern Asia | 100.0 /100 | #18 | Exceptional 11.2% |
| Iranians | 100.0 /100 | #19 | Exceptional 11.2% |
| Okinawans | 100.0 /100 | #20 | Exceptional 11.3% |
Demographics Similar to Italians by Female Poverty Among 25-34 Year Olds
In terms of female poverty among 25-34 year olds, the demographic groups most similar to Italians are Immigrants from Albania (12.5%, a difference of 0.15%), Immigrants from Austria (12.5%, a difference of 0.17%), Argentinean (12.5%, a difference of 0.24%), Norwegian (12.6%, a difference of 0.25%), and Croatian (12.5%, a difference of 0.27%).
| Demographics | Rating | Rank | Female Poverty Among 25-34 Year Olds |
| Ethiopians | 98.0 /100 | #82 | Exceptional 12.4% |
| Albanians | 97.7 /100 | #83 | Exceptional 12.5% |
| Immigrants | Latvia | 97.7 /100 | #84 | Exceptional 12.5% |
| Immigrants | South Eastern Asia | 97.6 /100 | #85 | Exceptional 12.5% |
| Croatians | 97.5 /100 | #86 | Exceptional 12.5% |
| Argentineans | 97.5 /100 | #87 | Exceptional 12.5% |
| Immigrants | Austria | 97.4 /100 | #88 | Exceptional 12.5% |
| Italians | 97.2 /100 | #89 | Exceptional 12.5% |
| Immigrants | Albania | 97.1 /100 | #90 | Exceptional 12.5% |
| Norwegians | 96.9 /100 | #91 | Exceptional 12.6% |
| Immigrants | Armenia | 96.9 /100 | #92 | Exceptional 12.6% |
| Palestinians | 96.9 /100 | #93 | Exceptional 12.6% |
| Immigrants | France | 96.8 /100 | #94 | Exceptional 12.6% |
| Ukrainians | 96.7 /100 | #95 | Exceptional 12.6% |
| Immigrants | Zimbabwe | 96.7 /100 | #96 | Exceptional 12.6% |