Immigrants from Peru vs Immigrants from Saudi Arabia Receiving Food Stamps
COMPARE
Immigrants from Peru
Immigrants from Saudi Arabia
Receiving Food Stamps
Receiving Food Stamps Comparison
Immigrants from Peru
Immigrants from Saudi Arabia
12.0%
RECEIVING FOOD STAMPS
32.2/ 100
METRIC RATING
190th/ 347
METRIC RANK
10.5%
RECEIVING FOOD STAMPS
94.9/ 100
METRIC RATING
115th/ 347
METRIC RANK
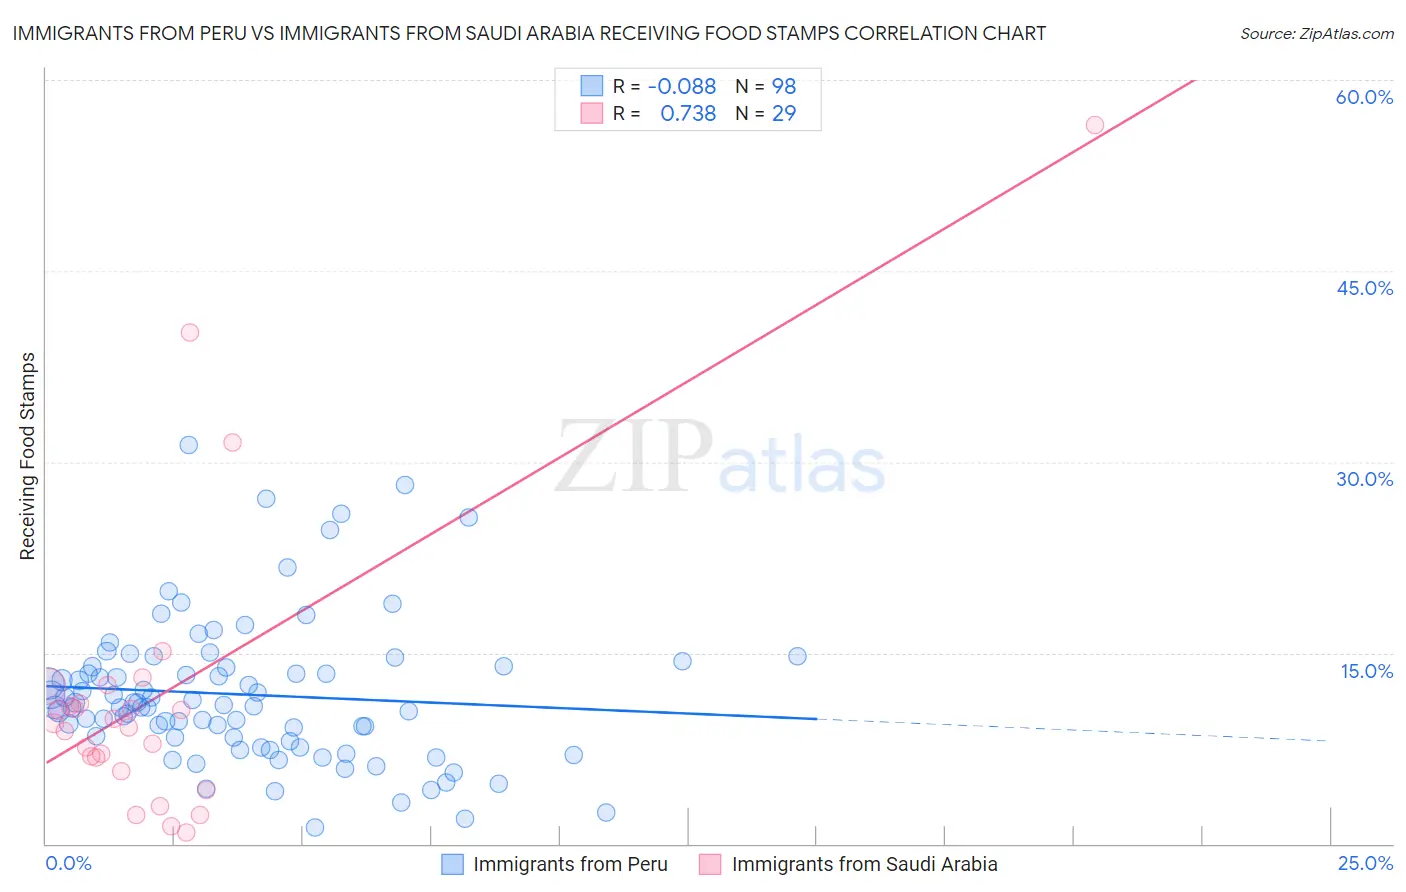
Immigrants from Peru vs Immigrants from Saudi Arabia Receiving Food Stamps Correlation Chart
The statistical analysis conducted on geographies consisting of 328,237,841 people shows a slight negative correlation between the proportion of Immigrants from Peru and percentage of population receiving government assistance and/or food stamps in the United States with a correlation coefficient (R) of -0.088 and weighted average of 12.0%. Similarly, the statistical analysis conducted on geographies consisting of 164,113,449 people shows a strong positive correlation between the proportion of Immigrants from Saudi Arabia and percentage of population receiving government assistance and/or food stamps in the United States with a correlation coefficient (R) of 0.738 and weighted average of 10.5%, a difference of 14.3%.
Receiving Food Stamps Correlation Summary
| Measurement | Immigrants from Peru | Immigrants from Saudi Arabia |
| Minimum | 1.3% | 0.90% |
| Maximum | 31.3% | 56.5% |
| Range | 30.0% | 55.6% |
| Mean | 11.7% | 11.7% |
| Median | 10.8% | 9.5% |
| Interquartile 25% (IQ1) | 8.3% | 6.2% |
| Interquartile 75% (IQ3) | 13.9% | 11.7% |
| Interquartile Range (IQR) | 5.6% | 5.5% |
| Standard Deviation (Sample) | 5.6% | 11.8% |
| Standard Deviation (Population) | 5.6% | 11.6% |
Similar Demographics by Receiving Food Stamps
Demographics Similar to Immigrants from Peru by Receiving Food Stamps
In terms of receiving food stamps, the demographic groups most similar to Immigrants from Peru are Venezuelan (12.0%, a difference of 0.010%), Immigrants from Cameroon (12.0%, a difference of 0.060%), Samoan (12.1%, a difference of 0.19%), Sudanese (12.0%, a difference of 0.20%), and Albanian (12.0%, a difference of 0.50%).
| Demographics | Rating | Rank | Receiving Food Stamps |
| Immigrants | Uganda | 40.3 /100 | #183 | Average 11.9% |
| Spaniards | 39.8 /100 | #184 | Fair 11.9% |
| Immigrants | Iraq | 37.1 /100 | #185 | Fair 12.0% |
| Spanish | 36.9 /100 | #186 | Fair 12.0% |
| Albanians | 35.4 /100 | #187 | Fair 12.0% |
| Sudanese | 33.4 /100 | #188 | Fair 12.0% |
| Immigrants | Cameroon | 32.5 /100 | #189 | Fair 12.0% |
| Immigrants | Peru | 32.2 /100 | #190 | Fair 12.0% |
| Venezuelans | 32.1 /100 | #191 | Fair 12.0% |
| Samoans | 31.0 /100 | #192 | Fair 12.1% |
| Immigrants | Fiji | 27.8 /100 | #193 | Fair 12.1% |
| Immigrants | Sudan | 27.1 /100 | #194 | Fair 12.1% |
| Americans | 26.7 /100 | #195 | Fair 12.2% |
| Iraqis | 26.6 /100 | #196 | Fair 12.2% |
| Delaware | 26.1 /100 | #197 | Fair 12.2% |
Demographics Similar to Immigrants from Saudi Arabia by Receiving Food Stamps
In terms of receiving food stamps, the demographic groups most similar to Immigrants from Saudi Arabia are Canadian (10.5%, a difference of 0.050%), Scotch-Irish (10.5%, a difference of 0.18%), Immigrants from Nepal (10.6%, a difference of 0.21%), Icelander (10.5%, a difference of 0.48%), and Assyrian/Chaldean/Syriac (10.6%, a difference of 0.54%).
| Demographics | Rating | Rank | Receiving Food Stamps |
| Carpatho Rusyns | 96.2 /100 | #108 | Exceptional 10.4% |
| Immigrants | Pakistan | 96.2 /100 | #109 | Exceptional 10.4% |
| Pakistanis | 95.9 /100 | #110 | Exceptional 10.4% |
| Romanians | 95.8 /100 | #111 | Exceptional 10.4% |
| Mongolians | 95.8 /100 | #112 | Exceptional 10.5% |
| Icelanders | 95.4 /100 | #113 | Exceptional 10.5% |
| Scotch-Irish | 95.1 /100 | #114 | Exceptional 10.5% |
| Immigrants | Saudi Arabia | 94.9 /100 | #115 | Exceptional 10.5% |
| Canadians | 94.8 /100 | #116 | Exceptional 10.5% |
| Immigrants | Nepal | 94.6 /100 | #117 | Exceptional 10.6% |
| Assyrians/Chaldeans/Syriacs | 94.1 /100 | #118 | Exceptional 10.6% |
| Immigrants | Poland | 93.9 /100 | #119 | Exceptional 10.6% |
| Ethiopians | 93.9 /100 | #120 | Exceptional 10.6% |
| Slavs | 93.8 /100 | #121 | Exceptional 10.6% |
| Sri Lankans | 93.7 /100 | #122 | Exceptional 10.6% |