Immigrants from Switzerland vs Immigrants from Saudi Arabia Receiving Food Stamps
COMPARE
Immigrants from Switzerland
Immigrants from Saudi Arabia
Receiving Food Stamps
Receiving Food Stamps Comparison
Immigrants from Switzerland
Immigrants from Saudi Arabia
9.7%
RECEIVING FOOD STAMPS
99.3/ 100
METRIC RATING
55th/ 347
METRIC RANK
10.5%
RECEIVING FOOD STAMPS
94.9/ 100
METRIC RATING
115th/ 347
METRIC RANK
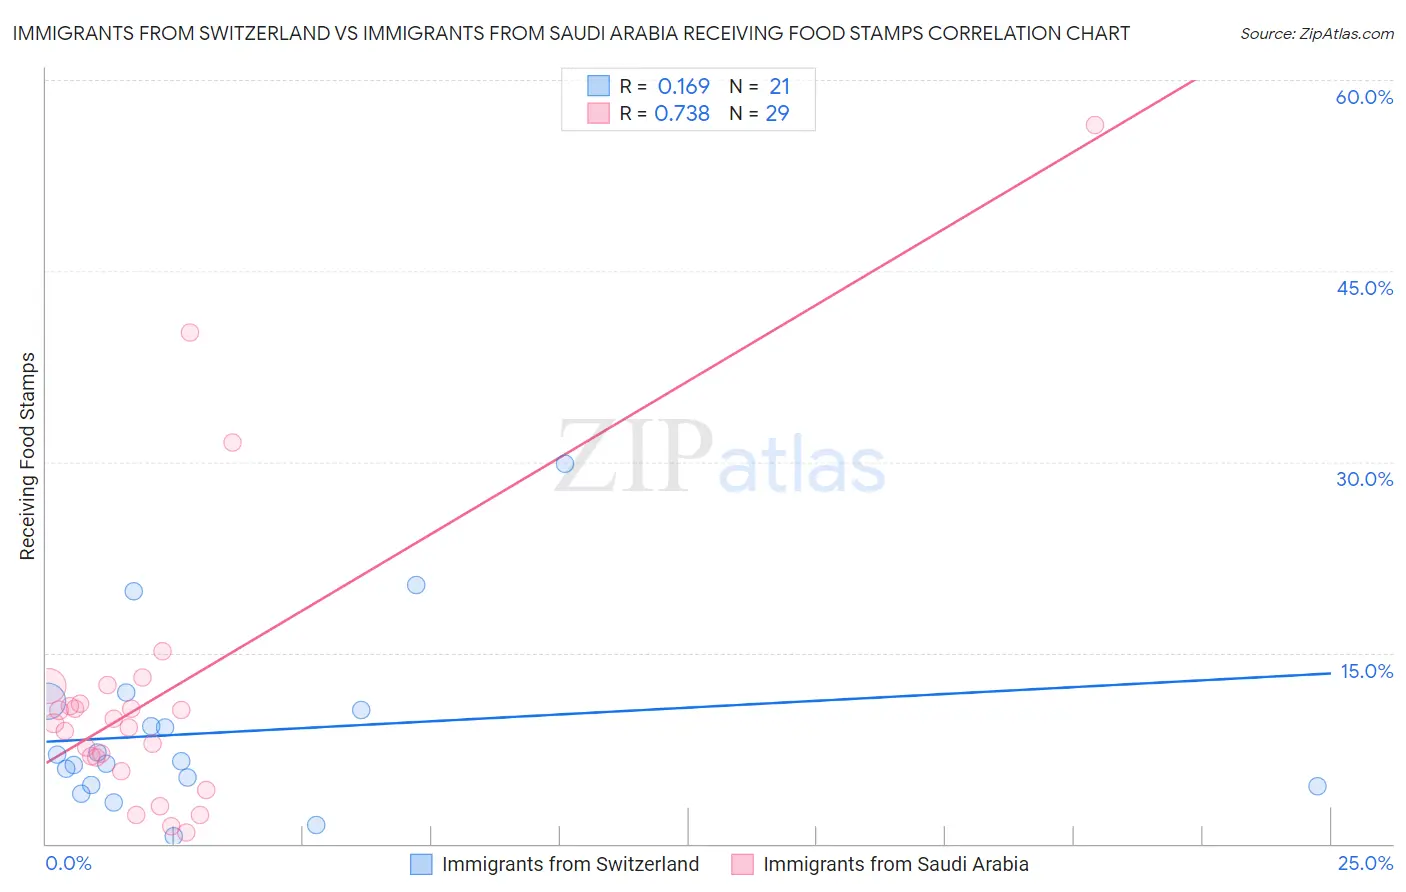
Immigrants from Switzerland vs Immigrants from Saudi Arabia Receiving Food Stamps Correlation Chart
The statistical analysis conducted on geographies consisting of 147,876,791 people shows a poor positive correlation between the proportion of Immigrants from Switzerland and percentage of population receiving government assistance and/or food stamps in the United States with a correlation coefficient (R) of 0.169 and weighted average of 9.7%. Similarly, the statistical analysis conducted on geographies consisting of 164,113,449 people shows a strong positive correlation between the proportion of Immigrants from Saudi Arabia and percentage of population receiving government assistance and/or food stamps in the United States with a correlation coefficient (R) of 0.738 and weighted average of 10.5%, a difference of 8.7%.
Receiving Food Stamps Correlation Summary
| Measurement | Immigrants from Switzerland | Immigrants from Saudi Arabia |
| Minimum | 0.61% | 0.90% |
| Maximum | 29.9% | 56.5% |
| Range | 29.3% | 55.6% |
| Mean | 8.8% | 11.7% |
| Median | 6.5% | 9.5% |
| Interquartile 25% (IQ1) | 4.5% | 6.2% |
| Interquartile 75% (IQ3) | 10.9% | 11.7% |
| Interquartile Range (IQR) | 6.3% | 5.5% |
| Standard Deviation (Sample) | 7.0% | 11.8% |
| Standard Deviation (Population) | 6.8% | 11.6% |
Similar Demographics by Receiving Food Stamps
Demographics Similar to Immigrants from Switzerland by Receiving Food Stamps
In terms of receiving food stamps, the demographic groups most similar to Immigrants from Switzerland are Swiss (9.7%, a difference of 0.010%), Tongan (9.7%, a difference of 0.13%), Immigrants from South Africa (9.7%, a difference of 0.14%), Asian (9.7%, a difference of 0.16%), and Immigrants from Canada (9.7%, a difference of 0.18%).
| Demographics | Rating | Rank | Receiving Food Stamps |
| Russians | 99.4 /100 | #48 | Exceptional 9.6% |
| Immigrants | Czechoslovakia | 99.4 /100 | #49 | Exceptional 9.6% |
| Lithuanians | 99.4 /100 | #50 | Exceptional 9.7% |
| Asians | 99.3 /100 | #51 | Exceptional 9.7% |
| Immigrants | South Africa | 99.3 /100 | #52 | Exceptional 9.7% |
| Tongans | 99.3 /100 | #53 | Exceptional 9.7% |
| Swiss | 99.3 /100 | #54 | Exceptional 9.7% |
| Immigrants | Switzerland | 99.3 /100 | #55 | Exceptional 9.7% |
| Immigrants | Canada | 99.3 /100 | #56 | Exceptional 9.7% |
| Greeks | 99.3 /100 | #57 | Exceptional 9.7% |
| Scandinavians | 99.2 /100 | #58 | Exceptional 9.7% |
| British | 99.2 /100 | #59 | Exceptional 9.7% |
| Germans | 99.2 /100 | #60 | Exceptional 9.7% |
| English | 99.2 /100 | #61 | Exceptional 9.8% |
| Immigrants | Bulgaria | 99.2 /100 | #62 | Exceptional 9.8% |
Demographics Similar to Immigrants from Saudi Arabia by Receiving Food Stamps
In terms of receiving food stamps, the demographic groups most similar to Immigrants from Saudi Arabia are Canadian (10.5%, a difference of 0.050%), Scotch-Irish (10.5%, a difference of 0.18%), Immigrants from Nepal (10.6%, a difference of 0.21%), Icelander (10.5%, a difference of 0.48%), and Assyrian/Chaldean/Syriac (10.6%, a difference of 0.54%).
| Demographics | Rating | Rank | Receiving Food Stamps |
| Carpatho Rusyns | 96.2 /100 | #108 | Exceptional 10.4% |
| Immigrants | Pakistan | 96.2 /100 | #109 | Exceptional 10.4% |
| Pakistanis | 95.9 /100 | #110 | Exceptional 10.4% |
| Romanians | 95.8 /100 | #111 | Exceptional 10.4% |
| Mongolians | 95.8 /100 | #112 | Exceptional 10.5% |
| Icelanders | 95.4 /100 | #113 | Exceptional 10.5% |
| Scotch-Irish | 95.1 /100 | #114 | Exceptional 10.5% |
| Immigrants | Saudi Arabia | 94.9 /100 | #115 | Exceptional 10.5% |
| Canadians | 94.8 /100 | #116 | Exceptional 10.5% |
| Immigrants | Nepal | 94.6 /100 | #117 | Exceptional 10.6% |
| Assyrians/Chaldeans/Syriacs | 94.1 /100 | #118 | Exceptional 10.6% |
| Immigrants | Poland | 93.9 /100 | #119 | Exceptional 10.6% |
| Ethiopians | 93.9 /100 | #120 | Exceptional 10.6% |
| Slavs | 93.8 /100 | #121 | Exceptional 10.6% |
| Sri Lankans | 93.7 /100 | #122 | Exceptional 10.6% |