Immigrants from Peru vs Immigrants from Asia Seniors Poverty Over the Age of 65

COMPARE

Immigrants from Peru
Race
Ancestry
AfghanAfricanAlaska NativeAlaskan AthabascanAlbanianAleutAlsatianAmericanApacheArabArapahoArgentineanArmenianAssyrian/Chaldean/SyriacAustralianAustrianBahamianBangladeshiBarbadianBasqueBelgianBelizeanBermudanBhutaneseBlackfeetBolivianBrazilianBritishBritish West IndianBulgarianBurmeseCajunCambodianCanadianCape VerdeanCarpatho RusynCelticCentral AmericanCentral American IndianCherokeeCheyenneChickasawChileanChineseChippewaChoctawColombianColvilleComancheCosta RicanCreeCreekCroatianCrowCubanCypriotCzechCzechoslovakianDanishDelawareDominicanDutchDutch West IndianEastern EuropeanEcuadorianEgyptianEnglishEstonianEthiopianEuropeanFijianFilipinoFinnishFrenchFrench American IndianFrench CanadianGermanGerman RussianGhanaianGreekGuamanian/ChamorroGuatemalanGuyaneseHaitianHmongHonduranHopiHoumaHungarianIcelanderIndian (Asian)IndonesianInupiatIranianIraqiIrishIroquoisIsraeliItalianJamaicanJapaneseJordanianKenyanKiowaKoreanLaotianLatvianLebaneseLiberianLithuanianLumbeeLuxembourgerMacedonianMalaysianMalteseMarshalleseMenomineeMexicanMexican American IndianMongolianMoroccanNative HawaiianNavajoNepaleseNew ZealanderNicaraguanNigerianNorthern EuropeanNorwegianOkinawanOsageOttawaPaiutePakistaniPalestinianPanamanianParaguayanPennsylvania GermanPeruvianPimaPolishPortuguesePotawatomiPuebloPuerto RicanPuget Sound SalishRomanianRussianSalvadoranSamoanScandinavianScotch-IrishScottishSeminoleSenegaleseSerbianShoshoneSierra LeoneanSiouxSlavicSlovakSloveneSomaliSouth AfricanSouth AmericanSouth American IndianSoviet UnionSpaniardSpanishSpanish AmericanSpanish American IndianSri LankanSubsaharan AfricanSudaneseSwedishSwissSyrianTaiwaneseThaiTlingit-HaidaTohono O'OdhamTonganTrinidadian and TobagonianTsimshianTurkishU.S. Virgin IslanderUgandanUkrainianUruguayanUteVenezuelanVietnameseWelshWest IndianYakamaYaquiYugoslavianYumanYup'ikZimbabwean
Immigration
NonimmigrantsImmigrantsAfghanistanAfricaAlbaniaArgentinaArmeniaAustraliaAustriaBahamasBangladeshBarbadosBelarusBelgiumBelizeBoliviaBosnia and HerzegovinaBrazilBulgariaBurma/MyanmarCabo VerdeCambodiaCameroonCanadaCaribbeanCentral AmericaChileChinaColombiaCongoCosta RicaCroatiaCubaCzechoslovakiaDenmarkDominicaDominican RepublicEastern AfricaEastern AsiaEastern EuropeEcuadorEgyptEl SalvadorEnglandEritreaEthiopiaEuropeFijiFranceGermanyGhanaGreeceGrenadaGuatemalaGuyanaHaitiHondurasHong KongHungaryIndiaIndonesiaIranIraqIrelandIsraelItalyJamaicaJapanJordanKazakhstanKenyaKoreaKuwaitLaosLatin AmericaLatviaLebanonLiberiaLithuaniaMalaysiaMexicoMicronesiaMiddle AfricaMoldovaMoroccoNepalNetherlandsNicaraguaNigeriaNorth AmericaNorth MacedoniaNorthern AfricaNorthern EuropeNorwayOceaniaPakistanPanamaPeruPhilippinesPolandPortugalRomaniaRussiaSaudi ArabiaScotlandSenegalSerbiaSierra LeoneSingaporeSomaliaSouth AfricaSouth AmericaSouth Central AsiaSouth Eastern AsiaSouthern EuropeSpainSri LankaSt. Vincent and the GrenadinesSudanSwedenSwitzerlandSyriaTaiwanThailandTrinidad and TobagoTurkeyUgandaUkraineUruguayUzbekistanVenezuelaVietnamWest IndiesWestern AfricaWestern AsiaWestern EuropeYemenZaireZimbabweAzores
Immigrants from Asia
Race
Ancestry
AfghanAfricanAlaska NativeAlaskan AthabascanAlbanianAleutAlsatianAmericanApacheArabArapahoArgentineanArmenianAssyrian/Chaldean/SyriacAustralianAustrianBahamianBangladeshiBarbadianBasqueBelgianBelizeanBermudanBhutaneseBlackfeetBolivianBrazilianBritishBritish West IndianBulgarianBurmeseCajunCambodianCanadianCape VerdeanCarpatho RusynCelticCentral AmericanCentral American IndianCherokeeCheyenneChickasawChileanChineseChippewaChoctawColombianColvilleComancheCosta RicanCreeCreekCroatianCrowCubanCypriotCzechCzechoslovakianDanishDelawareDominicanDutchDutch West IndianEastern EuropeanEcuadorianEgyptianEnglishEstonianEthiopianEuropeanFijianFilipinoFinnishFrenchFrench American IndianFrench CanadianGermanGerman RussianGhanaianGreekGuamanian/ChamorroGuatemalanGuyaneseHaitianHmongHonduranHopiHoumaHungarianIcelanderIndian (Asian)IndonesianInupiatIranianIraqiIrishIroquoisIsraeliItalianJamaicanJapaneseJordanianKenyanKiowaKoreanLaotianLatvianLebaneseLiberianLithuanianLumbeeLuxembourgerMacedonianMalaysianMalteseMarshalleseMenomineeMexicanMexican American IndianMongolianMoroccanNative HawaiianNavajoNepaleseNew ZealanderNicaraguanNigerianNorthern EuropeanNorwegianOkinawanOsageOttawaPaiutePakistaniPalestinianPanamanianParaguayanPennsylvania GermanPeruvianPimaPolishPortuguesePotawatomiPuebloPuerto RicanPuget Sound SalishRomanianRussianSalvadoranSamoanScandinavianScotch-IrishScottishSeminoleSenegaleseSerbianShoshoneSierra LeoneanSiouxSlavicSlovakSloveneSomaliSouth AfricanSouth AmericanSouth American IndianSoviet UnionSpaniardSpanishSpanish AmericanSpanish American IndianSri LankanSubsaharan AfricanSudaneseSwedishSwissSyrianTaiwaneseThaiTlingit-HaidaTohono O'OdhamTonganTrinidadian and TobagonianTsimshianTurkishU.S. Virgin IslanderUgandanUkrainianUruguayanUteVenezuelanVietnameseWelshWest IndianYakamaYaquiYugoslavianYumanYup'ikZimbabwean
Immigration
NonimmigrantsImmigrantsAfghanistanAfricaAlbaniaArgentinaArmeniaAsiaAustraliaAustriaBahamasBangladeshBarbadosBelarusBelgiumBelizeBoliviaBosnia and HerzegovinaBrazilBulgariaBurma/MyanmarCabo VerdeCambodiaCameroonCanadaCaribbeanCentral AmericaChileChinaColombiaCongoCosta RicaCroatiaCubaCzechoslovakiaDenmarkDominicaDominican RepublicEastern AfricaEastern AsiaEastern EuropeEcuadorEgyptEl SalvadorEnglandEritreaEthiopiaEuropeFijiFranceGermanyGhanaGreeceGrenadaGuatemalaGuyanaHaitiHondurasHong KongHungaryIndiaIndonesiaIranIraqIrelandIsraelItalyJamaicaJapanJordanKazakhstanKenyaKoreaKuwaitLaosLatin AmericaLatviaLebanonLiberiaLithuaniaMalaysiaMexicoMicronesiaMiddle AfricaMoldovaMoroccoNepalNetherlandsNicaraguaNigeriaNorth AmericaNorth MacedoniaNorthern AfricaNorthern EuropeNorwayOceaniaPakistanPanamaPhilippinesPolandPortugalRomaniaRussiaSaudi ArabiaScotlandSenegalSerbiaSierra LeoneSingaporeSomaliaSouth AfricaSouth AmericaSouth Central AsiaSouth Eastern AsiaSouthern EuropeSpainSri LankaSt. Vincent and the GrenadinesSudanSwedenSwitzerlandSyriaTaiwanThailandTrinidad and TobagoTurkeyUgandaUkraineUruguayUzbekistanVenezuelaVietnamWest IndiesWestern AfricaWestern AsiaWestern EuropeYemenZaireZimbabweAzores
Seniors Poverty Over the Age of 65
Income
Poverty
Unemployment
Labor Participation
Family Structure
Vehicle Availability
Education Level
Disability

Seniors Poverty Over the Age of 65 Comparison

Immigrants from Peru

Immigrants from Asia

Tragic
Excellent
12.0%
SENIORS POVERTY OVER THE AGE OF 65
1.3/ 100
METRIC RATING
236th/ 347
METRIC RANK
10.6%
SENIORS POVERTY OVER THE AGE OF 65
80.8/ 100
METRIC RATING
143rd/ 347
METRIC RANK

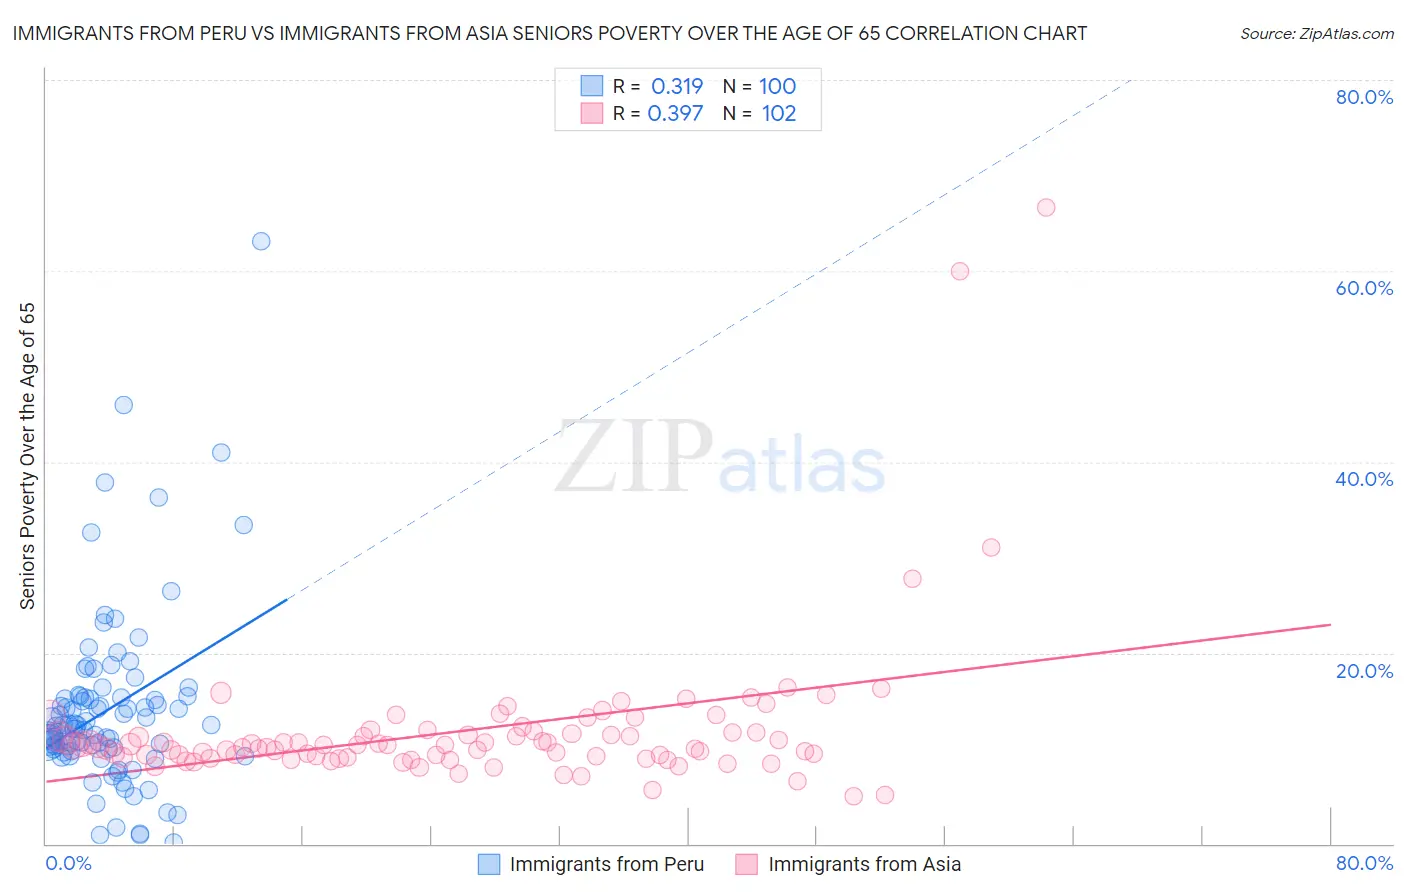
Immigrants from Peru vs Immigrants from Asia Seniors Poverty Over the Age of 65 Correlation Chart

The statistical analysis conducted on geographies consisting of 328,128,763 people shows a mild positive correlation between the proportion of Immigrants from Peru and poverty level among seniors over the age of 65 in the United States with a correlation coefficient (R) of 0.319 and weighted average of 12.0%. Similarly, the statistical analysis conducted on geographies consisting of 544,973,749 people shows a mild positive correlation between the proportion of Immigrants from Asia and poverty level among seniors over the age of 65 in the United States with a correlation coefficient (R) of 0.397 and weighted average of 10.6%, a difference of 13.2%.
Immigrants from Peru vs Immigrants from Asia Seniors Poverty Over the Age of 65

Seniors Poverty Over the Age of 65 Correlation Summary

MeasurementImmigrants from PeruImmigrants from Asia
Minimum0.12%5.0%
Maximum63.2%66.7%
Range63.0%61.6%
Mean14.1%11.9%
Median12.4%10.3%
Interquartile 25% (IQ1)10.0%9.1%
Interquartile 75% (IQ3)15.4%11.6%
Interquartile Range (IQR)5.4%2.6%
Standard Deviation (Sample)9.4%8.1%
Standard Deviation (Population)9.4%8.1%

Similar Demographics by Seniors Poverty Over the Age of 65

Demographics Similar to Immigrants from Peru by Seniors Poverty Over the Age of 65

In terms of seniors poverty over the age of 65, the demographic groups most similar to Immigrants from Peru are Immigrants from Argentina (12.0%, a difference of 0.030%), Moroccan (12.0%, a difference of 0.15%), Seminole (12.0%, a difference of 0.37%), Iroquois (11.9%, a difference of 0.53%), and Panamanian (11.9%, a difference of 0.63%).
DemographicsRating | RankSeniors Poverty Over the Age of 65
Immigrants | Eritrea
2.6
/100
|
#229
Tragic
11.8%
Bermudans
2.1
/100
|
#230
Tragic
11.9%
Cajuns
2.0
/100
|
#231
Tragic
11.9%
Yaqui
1.9
/100
|
#232
Tragic
11.9%
Panamanians
1.8
/100
|
#233
Tragic
11.9%
Iroquois
1.7
/100
|
#234
Tragic
11.9%
Immigrants | Argentina
1.3
/100
|
#235
Tragic
12.0%
Immigrants | Peru
1.3
/100
|
#236
Tragic
12.0%
Moroccans
1.2
/100
|
#237
Tragic
12.0%
Seminole
1.1
/100
|
#238
Tragic
12.0%
Immigrants | Spain
1.0
/100
|
#239
Tragic
12.1%
Comanche
0.9
/100
|
#240
Tragic
12.1%
Immigrants | Albania
0.9
/100
|
#241
Tragic
12.1%
Sub-Saharan Africans
0.9
/100
|
#242
Tragic
12.1%
Uruguayans
0.8
/100
|
#243
Tragic
12.1%

Demographics Similar to Immigrants from Asia by Seniors Poverty Over the Age of 65

In terms of seniors poverty over the age of 65, the demographic groups most similar to Immigrants from Asia are Iraqi (10.6%, a difference of 0.020%), Laotian (10.6%, a difference of 0.13%), Alaskan Athabascan (10.6%, a difference of 0.24%), Immigrants from Greece (10.6%, a difference of 0.26%), and Osage (10.6%, a difference of 0.32%).
DemographicsRating | RankSeniors Poverty Over the Age of 65
Immigrants | Serbia
86.4
/100
|
#136
Excellent
10.5%
Immigrants | Australia
85.1
/100
|
#137
Excellent
10.5%
Immigrants | Latvia
84.7
/100
|
#138
Excellent
10.5%
Portuguese
84.1
/100
|
#139
Excellent
10.5%
Immigrants | Kenya
83.4
/100
|
#140
Excellent
10.5%
Immigrants | Europe
83.3
/100
|
#141
Excellent
10.5%
Osage
82.8
/100
|
#142
Excellent
10.6%
Immigrants | Asia
80.8
/100
|
#143
Excellent
10.6%
Iraqis
80.7
/100
|
#144
Excellent
10.6%
Laotians
79.9
/100
|
#145
Good
10.6%
Alaskan Athabascans
79.1
/100
|
#146
Good
10.6%
Immigrants | Greece
79.0
/100
|
#147
Good
10.6%
Americans
78.1
/100
|
#148
Good
10.6%
Immigrants | Cameroon
78.1
/100
|
#149
Good
10.6%
Immigrants | Switzerland
77.3
/100
|
#150
Good
10.6%