Immigrants from Panama vs Cypriot Poverty
COMPARE
Immigrants from Panama
Cypriot
Poverty
Poverty Comparison
Immigrants from Panama
Cypriots
13.3%
POVERTY
4.1/ 100
METRIC RATING
213th/ 347
METRIC RANK
10.8%
POVERTY
99.3/ 100
METRIC RATING
36th/ 347
METRIC RANK
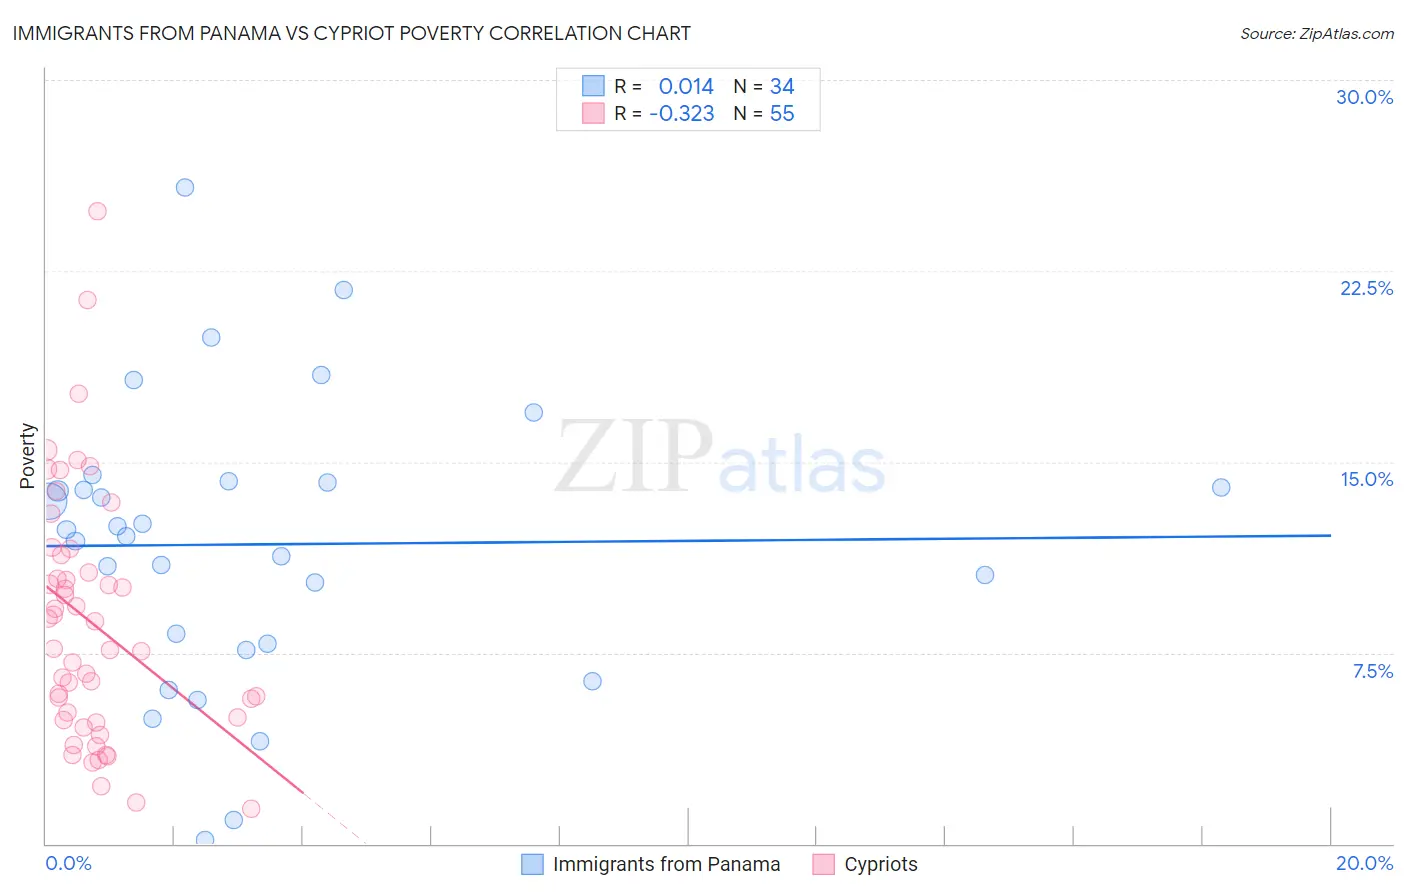
Immigrants from Panama vs Cypriot Poverty Correlation Chart
The statistical analysis conducted on geographies consisting of 221,154,793 people shows no correlation between the proportion of Immigrants from Panama and poverty level in the United States with a correlation coefficient (R) of 0.014 and weighted average of 13.3%. Similarly, the statistical analysis conducted on geographies consisting of 61,850,194 people shows a mild negative correlation between the proportion of Cypriots and poverty level in the United States with a correlation coefficient (R) of -0.323 and weighted average of 10.8%, a difference of 22.5%.
Poverty Correlation Summary
| Measurement | Immigrants from Panama | Cypriot |
| Minimum | 0.14% | 1.4% |
| Maximum | 25.8% | 24.8% |
| Range | 25.7% | 23.5% |
| Mean | 11.8% | 8.7% |
| Median | 12.2% | 7.7% |
| Interquartile 25% (IQ1) | 7.9% | 4.9% |
| Interquartile 75% (IQ3) | 14.2% | 11.4% |
| Interquartile Range (IQR) | 6.4% | 6.5% |
| Standard Deviation (Sample) | 5.6% | 4.9% |
| Standard Deviation (Population) | 5.5% | 4.9% |
Similar Demographics by Poverty
Demographics Similar to Immigrants from Panama by Poverty
In terms of poverty, the demographic groups most similar to Immigrants from Panama are Immigrants (13.2%, a difference of 0.13%), Bermudan (13.3%, a difference of 0.25%), Japanese (13.3%, a difference of 0.51%), Nonimmigrants (13.3%, a difference of 0.51%), and Immigrants from Uzbekistan (13.3%, a difference of 0.55%).
| Demographics | Rating | Rank | Poverty |
| Immigrants | Eastern Africa | 7.0 /100 | #206 | Tragic 13.1% |
| Panamanians | 6.6 /100 | #207 | Tragic 13.1% |
| Ugandans | 6.2 /100 | #208 | Tragic 13.1% |
| Malaysians | 6.1 /100 | #209 | Tragic 13.1% |
| Immigrants | Azores | 6.1 /100 | #210 | Tragic 13.1% |
| Moroccans | 5.2 /100 | #211 | Tragic 13.2% |
| Immigrants | Immigrants | 4.3 /100 | #212 | Tragic 13.2% |
| Immigrants | Panama | 4.1 /100 | #213 | Tragic 13.3% |
| Bermudans | 3.7 /100 | #214 | Tragic 13.3% |
| Japanese | 3.3 /100 | #215 | Tragic 13.3% |
| Immigrants | Nonimmigrants | 3.3 /100 | #216 | Tragic 13.3% |
| Immigrants | Uzbekistan | 3.2 /100 | #217 | Tragic 13.3% |
| Immigrants | Thailand | 3.1 /100 | #218 | Tragic 13.3% |
| Immigrants | Cambodia | 3.0 /100 | #219 | Tragic 13.4% |
| Americans | 2.9 /100 | #220 | Tragic 13.4% |
Demographics Similar to Cypriots by Poverty
In terms of poverty, the demographic groups most similar to Cypriots are Tongan (10.8%, a difference of 0.080%), Immigrants from Greece (10.8%, a difference of 0.10%), Immigrants from Poland (10.8%, a difference of 0.12%), Czech (10.8%, a difference of 0.14%), and Macedonian (10.8%, a difference of 0.21%).
| Demographics | Rating | Rank | Poverty |
| Greeks | 99.5 /100 | #29 | Exceptional 10.7% |
| Danes | 99.5 /100 | #30 | Exceptional 10.7% |
| Poles | 99.5 /100 | #31 | Exceptional 10.7% |
| Iranians | 99.5 /100 | #32 | Exceptional 10.7% |
| Macedonians | 99.4 /100 | #33 | Exceptional 10.8% |
| Immigrants | Poland | 99.4 /100 | #34 | Exceptional 10.8% |
| Tongans | 99.4 /100 | #35 | Exceptional 10.8% |
| Cypriots | 99.3 /100 | #36 | Exceptional 10.8% |
| Immigrants | Greece | 99.3 /100 | #37 | Exceptional 10.8% |
| Czechs | 99.3 /100 | #38 | Exceptional 10.8% |
| Immigrants | Pakistan | 99.3 /100 | #39 | Exceptional 10.8% |
| Russians | 99.3 /100 | #40 | Exceptional 10.9% |
| Immigrants | Iran | 99.2 /100 | #41 | Exceptional 10.9% |
| Koreans | 99.2 /100 | #42 | Exceptional 10.9% |
| Immigrants | Singapore | 99.2 /100 | #43 | Exceptional 10.9% |