Sierra Leonean vs Cypriot Poverty
COMPARE
Sierra Leonean
Cypriot
Poverty
Poverty Comparison
Sierra Leoneans
Cypriots
12.6%
POVERTY
31.5/ 100
METRIC RATING
191st/ 347
METRIC RANK
10.8%
POVERTY
99.3/ 100
METRIC RATING
36th/ 347
METRIC RANK
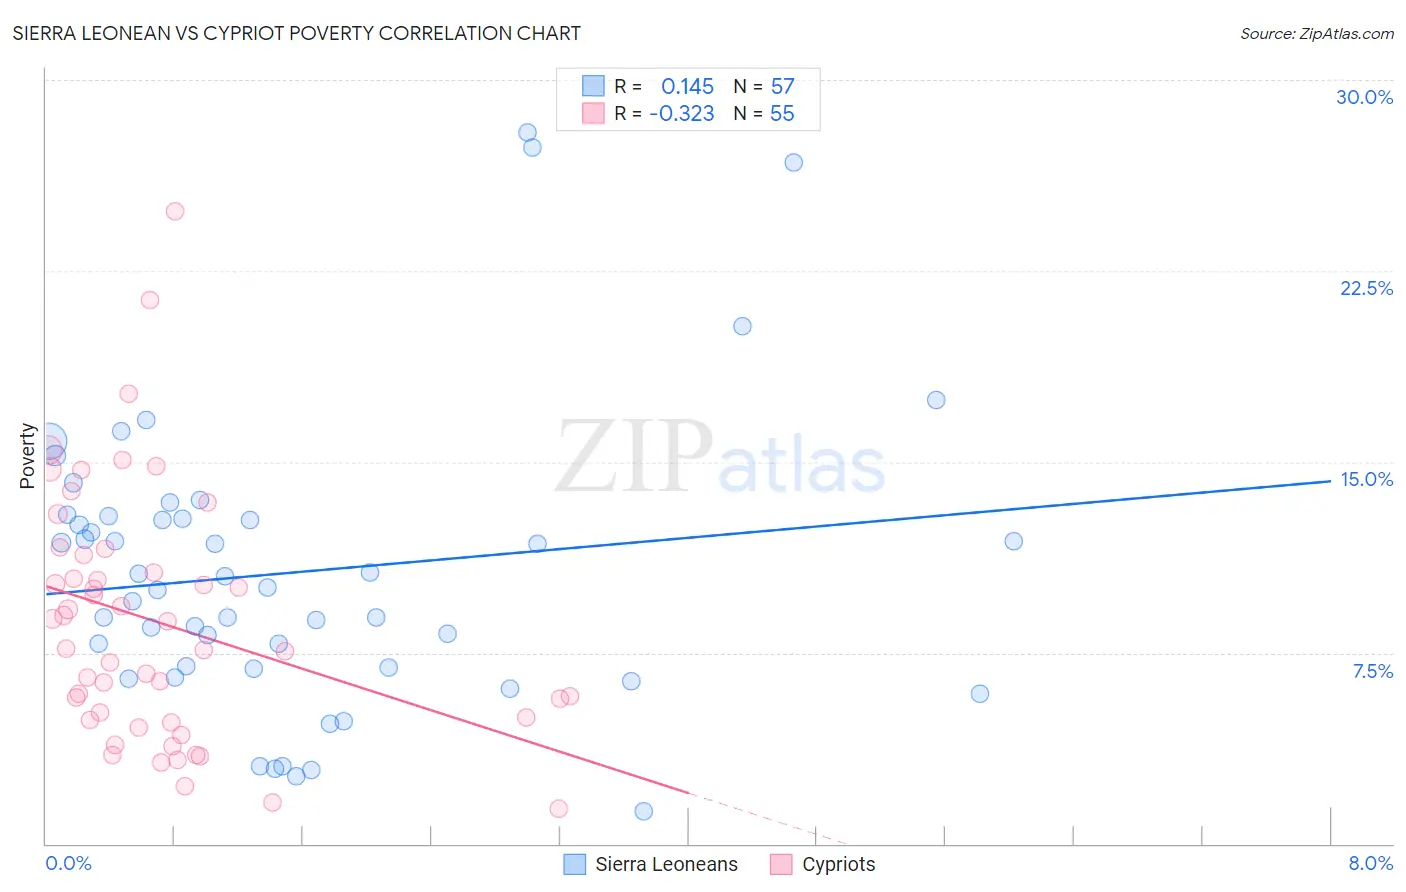
Sierra Leonean vs Cypriot Poverty Correlation Chart
The statistical analysis conducted on geographies consisting of 83,348,964 people shows a poor positive correlation between the proportion of Sierra Leoneans and poverty level in the United States with a correlation coefficient (R) of 0.145 and weighted average of 12.6%. Similarly, the statistical analysis conducted on geographies consisting of 61,850,194 people shows a mild negative correlation between the proportion of Cypriots and poverty level in the United States with a correlation coefficient (R) of -0.323 and weighted average of 10.8%, a difference of 16.0%.
Poverty Correlation Summary
| Measurement | Sierra Leonean | Cypriot |
| Minimum | 1.3% | 1.4% |
| Maximum | 27.9% | 24.8% |
| Range | 26.7% | 23.5% |
| Mean | 10.7% | 8.7% |
| Median | 10.1% | 7.7% |
| Interquartile 25% (IQ1) | 6.9% | 4.9% |
| Interquartile 75% (IQ3) | 12.8% | 11.4% |
| Interquartile Range (IQR) | 5.9% | 6.5% |
| Standard Deviation (Sample) | 5.7% | 4.9% |
| Standard Deviation (Population) | 5.6% | 4.9% |
Similar Demographics by Poverty
Demographics Similar to Sierra Leoneans by Poverty
In terms of poverty, the demographic groups most similar to Sierra Leoneans are Immigrants from South America (12.5%, a difference of 0.10%), Aleut (12.5%, a difference of 0.19%), Immigrants from Costa Rica (12.5%, a difference of 0.20%), Hawaiian (12.5%, a difference of 0.29%), and Immigrants from Sierra Leone (12.5%, a difference of 0.51%).
| Demographics | Rating | Rank | Poverty |
| Kenyans | 38.8 /100 | #184 | Fair 12.5% |
| Israelis | 36.4 /100 | #185 | Fair 12.5% |
| Immigrants | Sierra Leone | 36.3 /100 | #186 | Fair 12.5% |
| Hawaiians | 34.1 /100 | #187 | Fair 12.5% |
| Immigrants | Costa Rica | 33.3 /100 | #188 | Fair 12.5% |
| Aleuts | 33.2 /100 | #189 | Fair 12.5% |
| Immigrants | South America | 32.3 /100 | #190 | Fair 12.5% |
| Sierra Leoneans | 31.5 /100 | #191 | Fair 12.6% |
| South American Indians | 23.3 /100 | #192 | Fair 12.7% |
| Delaware | 21.4 /100 | #193 | Fair 12.7% |
| Arabs | 21.1 /100 | #194 | Fair 12.7% |
| Immigrants | Kuwait | 20.9 /100 | #195 | Fair 12.7% |
| Iraqis | 20.8 /100 | #196 | Fair 12.7% |
| Immigrants | Lebanon | 18.7 /100 | #197 | Poor 12.8% |
| Spanish | 18.7 /100 | #198 | Poor 12.8% |
Demographics Similar to Cypriots by Poverty
In terms of poverty, the demographic groups most similar to Cypriots are Tongan (10.8%, a difference of 0.080%), Immigrants from Greece (10.8%, a difference of 0.10%), Immigrants from Poland (10.8%, a difference of 0.12%), Czech (10.8%, a difference of 0.14%), and Macedonian (10.8%, a difference of 0.21%).
| Demographics | Rating | Rank | Poverty |
| Greeks | 99.5 /100 | #29 | Exceptional 10.7% |
| Danes | 99.5 /100 | #30 | Exceptional 10.7% |
| Poles | 99.5 /100 | #31 | Exceptional 10.7% |
| Iranians | 99.5 /100 | #32 | Exceptional 10.7% |
| Macedonians | 99.4 /100 | #33 | Exceptional 10.8% |
| Immigrants | Poland | 99.4 /100 | #34 | Exceptional 10.8% |
| Tongans | 99.4 /100 | #35 | Exceptional 10.8% |
| Cypriots | 99.3 /100 | #36 | Exceptional 10.8% |
| Immigrants | Greece | 99.3 /100 | #37 | Exceptional 10.8% |
| Czechs | 99.3 /100 | #38 | Exceptional 10.8% |
| Immigrants | Pakistan | 99.3 /100 | #39 | Exceptional 10.8% |
| Russians | 99.3 /100 | #40 | Exceptional 10.9% |
| Immigrants | Iran | 99.2 /100 | #41 | Exceptional 10.9% |
| Koreans | 99.2 /100 | #42 | Exceptional 10.9% |
| Immigrants | Singapore | 99.2 /100 | #43 | Exceptional 10.9% |