Immigrants from Panama vs Italian Poverty
COMPARE
Immigrants from Panama
Italian
Poverty
Poverty Comparison
Immigrants from Panama
Italians
13.3%
POVERTY
4.1/ 100
METRIC RATING
213th/ 347
METRIC RANK
10.6%
POVERTY
99.7/ 100
METRIC RATING
24th/ 347
METRIC RANK
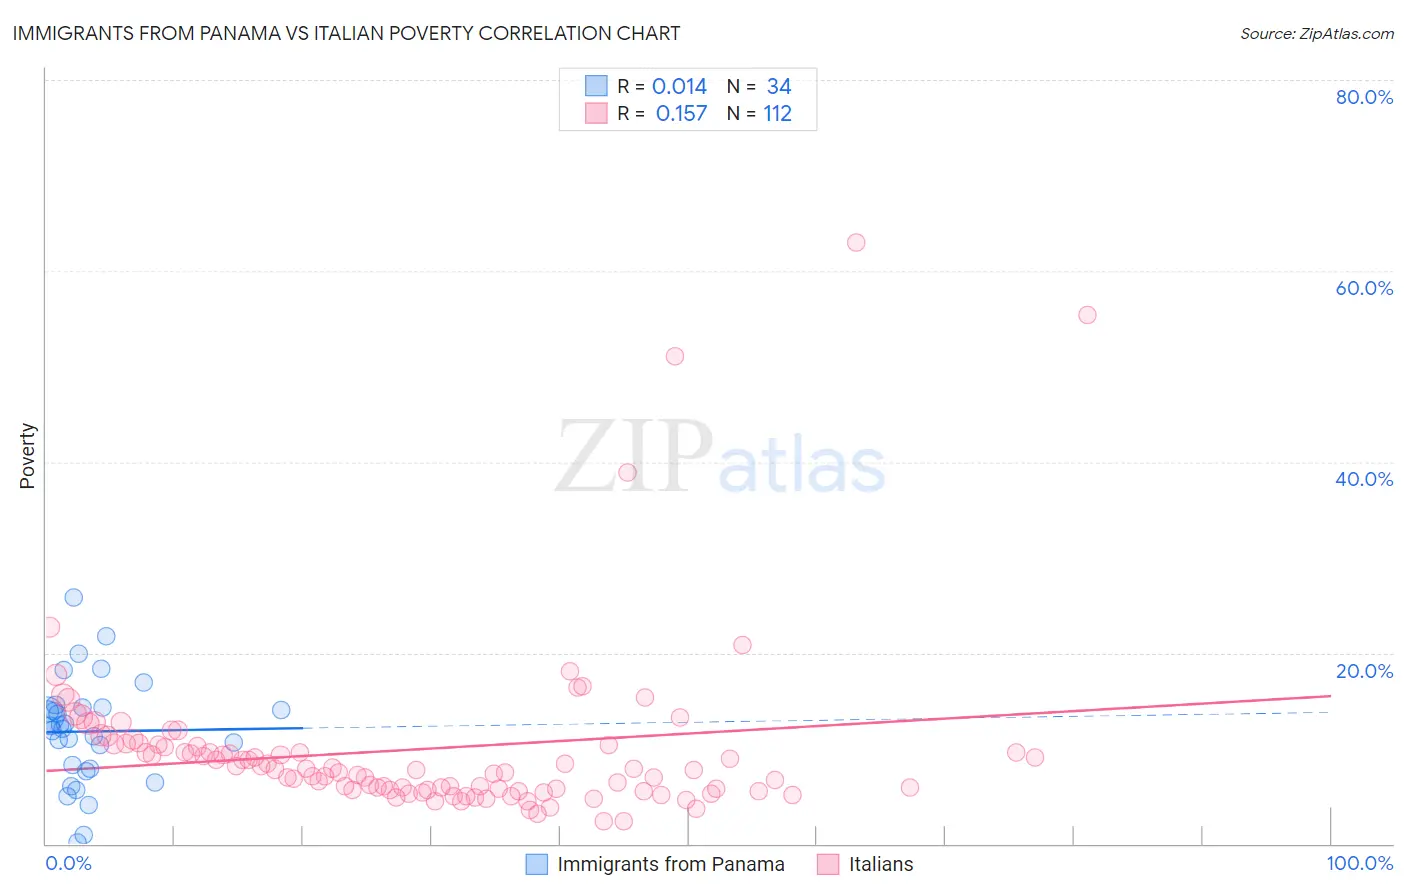
Immigrants from Panama vs Italian Poverty Correlation Chart
The statistical analysis conducted on geographies consisting of 221,154,793 people shows no correlation between the proportion of Immigrants from Panama and poverty level in the United States with a correlation coefficient (R) of 0.014 and weighted average of 13.3%. Similarly, the statistical analysis conducted on geographies consisting of 574,117,445 people shows a poor positive correlation between the proportion of Italians and poverty level in the United States with a correlation coefficient (R) of 0.157 and weighted average of 10.6%, a difference of 24.9%.
Poverty Correlation Summary
| Measurement | Immigrants from Panama | Italian |
| Minimum | 0.14% | 2.3% |
| Maximum | 25.8% | 63.0% |
| Range | 25.7% | 60.7% |
| Mean | 11.8% | 9.9% |
| Median | 12.2% | 7.8% |
| Interquartile 25% (IQ1) | 7.9% | 5.6% |
| Interquartile 75% (IQ3) | 14.2% | 10.4% |
| Interquartile Range (IQR) | 6.4% | 4.8% |
| Standard Deviation (Sample) | 5.6% | 9.1% |
| Standard Deviation (Population) | 5.5% | 9.1% |
Similar Demographics by Poverty
Demographics Similar to Immigrants from Panama by Poverty
In terms of poverty, the demographic groups most similar to Immigrants from Panama are Immigrants (13.2%, a difference of 0.13%), Bermudan (13.3%, a difference of 0.25%), Japanese (13.3%, a difference of 0.51%), Nonimmigrants (13.3%, a difference of 0.51%), and Immigrants from Uzbekistan (13.3%, a difference of 0.55%).
| Demographics | Rating | Rank | Poverty |
| Immigrants | Eastern Africa | 7.0 /100 | #206 | Tragic 13.1% |
| Panamanians | 6.6 /100 | #207 | Tragic 13.1% |
| Ugandans | 6.2 /100 | #208 | Tragic 13.1% |
| Malaysians | 6.1 /100 | #209 | Tragic 13.1% |
| Immigrants | Azores | 6.1 /100 | #210 | Tragic 13.1% |
| Moroccans | 5.2 /100 | #211 | Tragic 13.2% |
| Immigrants | Immigrants | 4.3 /100 | #212 | Tragic 13.2% |
| Immigrants | Panama | 4.1 /100 | #213 | Tragic 13.3% |
| Bermudans | 3.7 /100 | #214 | Tragic 13.3% |
| Japanese | 3.3 /100 | #215 | Tragic 13.3% |
| Immigrants | Nonimmigrants | 3.3 /100 | #216 | Tragic 13.3% |
| Immigrants | Uzbekistan | 3.2 /100 | #217 | Tragic 13.3% |
| Immigrants | Thailand | 3.1 /100 | #218 | Tragic 13.3% |
| Immigrants | Cambodia | 3.0 /100 | #219 | Tragic 13.4% |
| Americans | 2.9 /100 | #220 | Tragic 13.4% |
Demographics Similar to Italians by Poverty
In terms of poverty, the demographic groups most similar to Italians are Swedish (10.6%, a difference of 0.050%), Eastern European (10.6%, a difference of 0.15%), Croatian (10.6%, a difference of 0.19%), Luxembourger (10.6%, a difference of 0.31%), and Immigrants from North Macedonia (10.6%, a difference of 0.39%).
| Demographics | Rating | Rank | Poverty |
| Norwegians | 99.8 /100 | #17 | Exceptional 10.5% |
| Latvians | 99.8 /100 | #18 | Exceptional 10.5% |
| Immigrants | Scotland | 99.7 /100 | #19 | Exceptional 10.6% |
| Immigrants | North Macedonia | 99.7 /100 | #20 | Exceptional 10.6% |
| Luxembourgers | 99.7 /100 | #21 | Exceptional 10.6% |
| Eastern Europeans | 99.7 /100 | #22 | Exceptional 10.6% |
| Swedes | 99.7 /100 | #23 | Exceptional 10.6% |
| Italians | 99.7 /100 | #24 | Exceptional 10.6% |
| Croatians | 99.6 /100 | #25 | Exceptional 10.6% |
| Burmese | 99.6 /100 | #26 | Exceptional 10.7% |
| Immigrants | Northern Europe | 99.6 /100 | #27 | Exceptional 10.7% |
| Immigrants | Korea | 99.5 /100 | #28 | Exceptional 10.7% |
| Greeks | 99.5 /100 | #29 | Exceptional 10.7% |
| Danes | 99.5 /100 | #30 | Exceptional 10.7% |
| Poles | 99.5 /100 | #31 | Exceptional 10.7% |