Immigrants from Panama vs Cypriot No Vehicles in Household
COMPARE
Immigrants from Panama
Cypriot
No Vehicles in Household
No Vehicles in Household Comparison
Immigrants from Panama
Cypriots
14.6%
NO VEHICLES IN HOUSEHOLD
0.0/ 100
METRIC RATING
297th/ 347
METRIC RANK
15.7%
NO VEHICLES IN HOUSEHOLD
0.0/ 100
METRIC RATING
315th/ 347
METRIC RANK
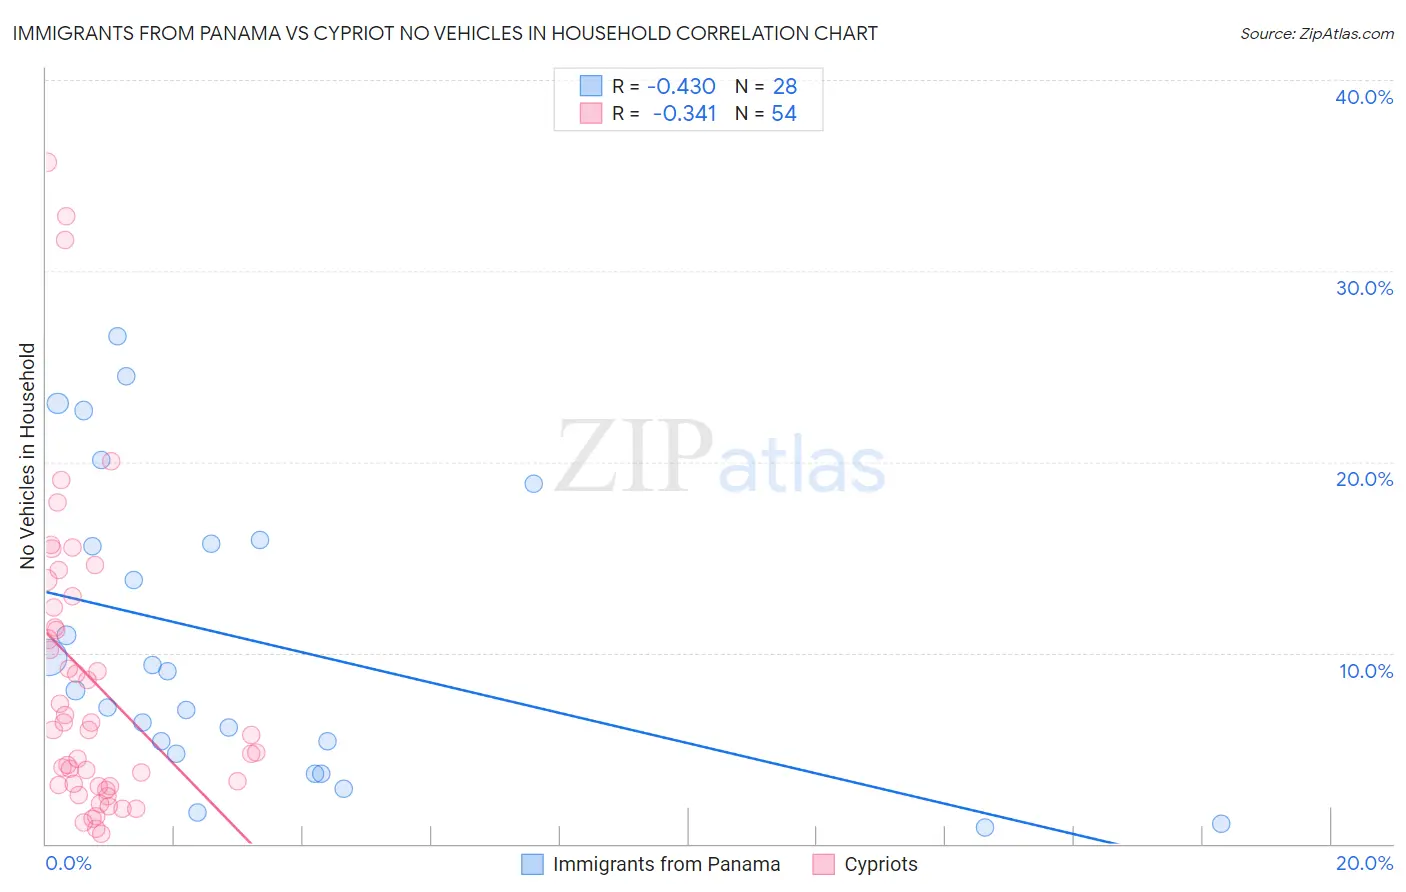
Immigrants from Panama vs Cypriot No Vehicles in Household Correlation Chart
The statistical analysis conducted on geographies consisting of 221,041,162 people shows a moderate negative correlation between the proportion of Immigrants from Panama and percentage of households with no vehicle available in the United States with a correlation coefficient (R) of -0.430 and weighted average of 14.6%. Similarly, the statistical analysis conducted on geographies consisting of 61,831,419 people shows a mild negative correlation between the proportion of Cypriots and percentage of households with no vehicle available in the United States with a correlation coefficient (R) of -0.341 and weighted average of 15.7%, a difference of 7.0%.
No Vehicles in Household Correlation Summary
| Measurement | Immigrants from Panama | Cypriot |
| Minimum | 0.82% | 0.54% |
| Maximum | 26.6% | 35.7% |
| Range | 25.8% | 35.1% |
| Mean | 10.7% | 8.6% |
| Median | 8.5% | 6.0% |
| Interquartile 25% (IQ1) | 5.0% | 3.0% |
| Interquartile 75% (IQ3) | 15.8% | 12.4% |
| Interquartile Range (IQR) | 10.8% | 9.4% |
| Standard Deviation (Sample) | 7.7% | 8.0% |
| Standard Deviation (Population) | 7.5% | 7.9% |
Demographics Similar to Immigrants from Panama and Cypriots by No Vehicles in Household
In terms of no vehicles in household, the demographic groups most similar to Immigrants from Panama are Moroccan (14.7%, a difference of 0.15%), Immigrants from Greece (14.7%, a difference of 0.35%), Immigrants from Spain (14.5%, a difference of 0.67%), Yuman (14.9%, a difference of 1.4%), and Immigrants from Ukraine (14.9%, a difference of 1.4%). Similarly, the demographic groups most similar to Cypriots are Albanian (15.6%, a difference of 0.13%), Tohono O'odham (15.6%, a difference of 0.29%), Alaskan Athabascan (15.6%, a difference of 0.44%), Immigrants from Israel (15.6%, a difference of 0.59%), and Cape Verdean (15.6%, a difference of 0.60%).
| Demographics | Rating | Rank | No Vehicles in Household |
| Immigrants | Spain | 0.0 /100 | #296 | Tragic 14.5% |
| Immigrants | Panama | 0.0 /100 | #297 | Tragic 14.6% |
| Moroccans | 0.0 /100 | #298 | Tragic 14.7% |
| Immigrants | Greece | 0.0 /100 | #299 | Tragic 14.7% |
| Yuman | 0.0 /100 | #300 | Tragic 14.9% |
| Immigrants | Ukraine | 0.0 /100 | #301 | Tragic 14.9% |
| Haitians | 0.0 /100 | #302 | Tragic 14.9% |
| Immigrants | Western Africa | 0.0 /100 | #303 | Tragic 15.0% |
| Immigrants | Russia | 0.0 /100 | #304 | Tragic 15.1% |
| Immigrants | China | 0.0 /100 | #305 | Tragic 15.2% |
| Immigrants | Belize | 0.0 /100 | #306 | Tragic 15.4% |
| Immigrants | Haiti | 0.0 /100 | #307 | Tragic 15.4% |
| U.S. Virgin Islanders | 0.0 /100 | #308 | Tragic 15.4% |
| Puerto Ricans | 0.0 /100 | #309 | Tragic 15.5% |
| Cape Verdeans | 0.0 /100 | #310 | Tragic 15.6% |
| Immigrants | Israel | 0.0 /100 | #311 | Tragic 15.6% |
| Alaskan Athabascans | 0.0 /100 | #312 | Tragic 15.6% |
| Tohono O'odham | 0.0 /100 | #313 | Tragic 15.6% |
| Albanians | 0.0 /100 | #314 | Tragic 15.6% |
| Cypriots | 0.0 /100 | #315 | Tragic 15.7% |
| Ghanaians | 0.0 /100 | #316 | Tragic 16.4% |