Immigrants from Panama vs Immigrants from France Poverty
COMPARE
Immigrants from Panama
Immigrants from France
Poverty
Poverty Comparison
Immigrants from Panama
Immigrants from France
13.3%
POVERTY
4.1/ 100
METRIC RATING
213th/ 347
METRIC RANK
11.9%
POVERTY
80.5/ 100
METRIC RATING
141st/ 347
METRIC RANK
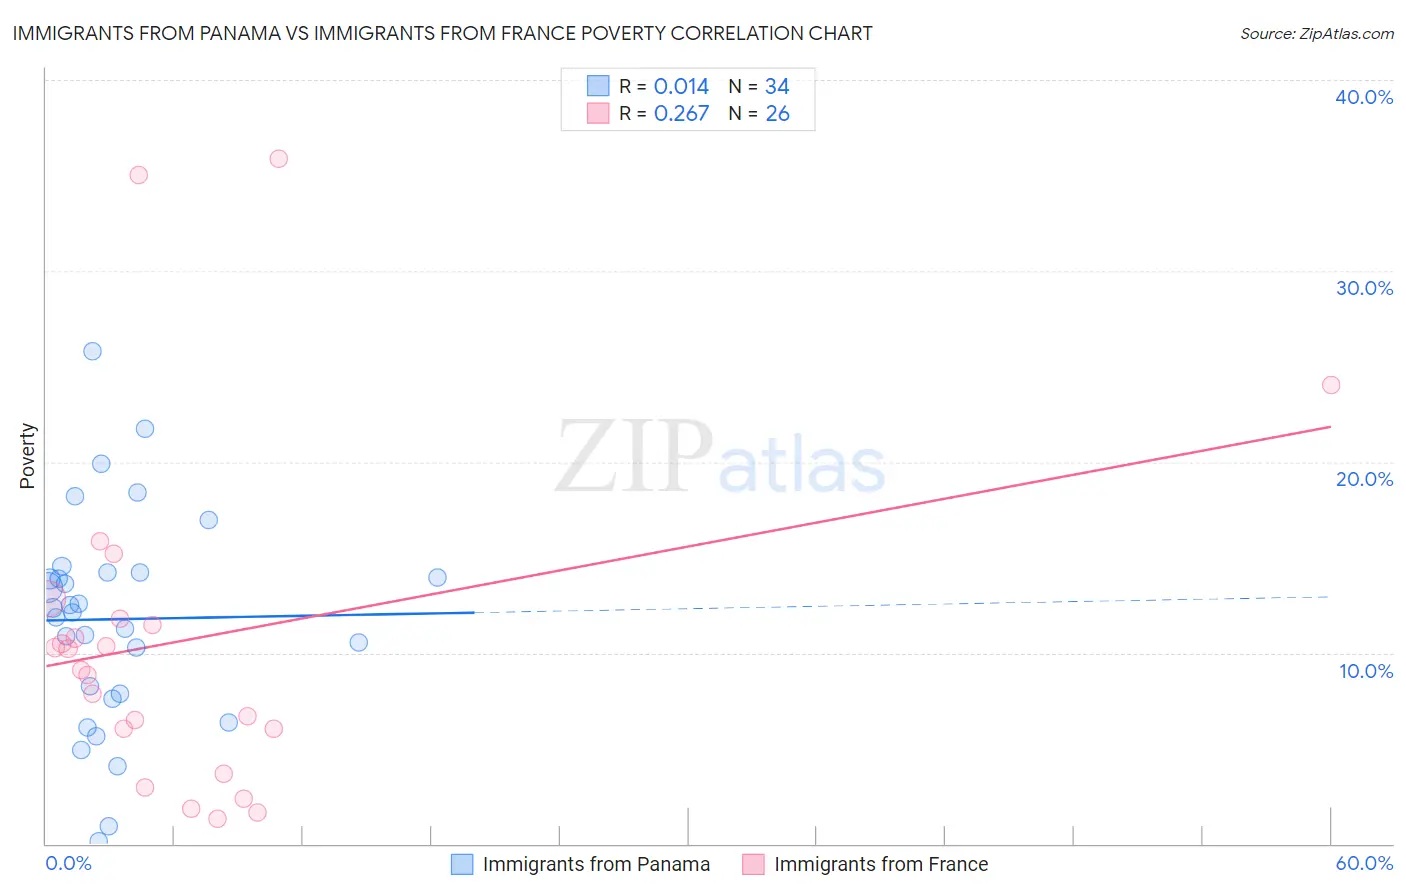
Immigrants from Panama vs Immigrants from France Poverty Correlation Chart
The statistical analysis conducted on geographies consisting of 221,154,793 people shows no correlation between the proportion of Immigrants from Panama and poverty level in the United States with a correlation coefficient (R) of 0.014 and weighted average of 13.3%. Similarly, the statistical analysis conducted on geographies consisting of 287,842,185 people shows a weak positive correlation between the proportion of Immigrants from France and poverty level in the United States with a correlation coefficient (R) of 0.267 and weighted average of 11.9%, a difference of 11.5%.
Poverty Correlation Summary
| Measurement | Immigrants from Panama | Immigrants from France |
| Minimum | 0.14% | 1.3% |
| Maximum | 25.8% | 35.9% |
| Range | 25.7% | 34.6% |
| Mean | 11.8% | 10.7% |
| Median | 12.2% | 9.7% |
| Interquartile 25% (IQ1) | 7.9% | 6.0% |
| Interquartile 75% (IQ3) | 14.2% | 11.8% |
| Interquartile Range (IQR) | 6.4% | 5.8% |
| Standard Deviation (Sample) | 5.6% | 8.9% |
| Standard Deviation (Population) | 5.5% | 8.7% |
Similar Demographics by Poverty
Demographics Similar to Immigrants from Panama by Poverty
In terms of poverty, the demographic groups most similar to Immigrants from Panama are Immigrants (13.2%, a difference of 0.13%), Bermudan (13.3%, a difference of 0.25%), Japanese (13.3%, a difference of 0.51%), Nonimmigrants (13.3%, a difference of 0.51%), and Immigrants from Uzbekistan (13.3%, a difference of 0.55%).
| Demographics | Rating | Rank | Poverty |
| Immigrants | Eastern Africa | 7.0 /100 | #206 | Tragic 13.1% |
| Panamanians | 6.6 /100 | #207 | Tragic 13.1% |
| Ugandans | 6.2 /100 | #208 | Tragic 13.1% |
| Malaysians | 6.1 /100 | #209 | Tragic 13.1% |
| Immigrants | Azores | 6.1 /100 | #210 | Tragic 13.1% |
| Moroccans | 5.2 /100 | #211 | Tragic 13.2% |
| Immigrants | Immigrants | 4.3 /100 | #212 | Tragic 13.2% |
| Immigrants | Panama | 4.1 /100 | #213 | Tragic 13.3% |
| Bermudans | 3.7 /100 | #214 | Tragic 13.3% |
| Japanese | 3.3 /100 | #215 | Tragic 13.3% |
| Immigrants | Nonimmigrants | 3.3 /100 | #216 | Tragic 13.3% |
| Immigrants | Uzbekistan | 3.2 /100 | #217 | Tragic 13.3% |
| Immigrants | Thailand | 3.1 /100 | #218 | Tragic 13.3% |
| Immigrants | Cambodia | 3.0 /100 | #219 | Tragic 13.4% |
| Americans | 2.9 /100 | #220 | Tragic 13.4% |
Demographics Similar to Immigrants from France by Poverty
In terms of poverty, the demographic groups most similar to Immigrants from France are Basque (11.9%, a difference of 0.020%), Immigrants from Peru (11.9%, a difference of 0.090%), Brazilian (11.9%, a difference of 0.12%), Pakistani (11.9%, a difference of 0.28%), and Immigrants from Jordan (11.9%, a difference of 0.31%).
| Demographics | Rating | Rank | Poverty |
| Yugoslavians | 85.2 /100 | #134 | Excellent 11.8% |
| Immigrants | Vietnam | 85.2 /100 | #135 | Excellent 11.8% |
| Chileans | 84.2 /100 | #136 | Excellent 11.8% |
| Immigrants | Switzerland | 83.0 /100 | #137 | Excellent 11.8% |
| Immigrants | Jordan | 82.4 /100 | #138 | Excellent 11.9% |
| Pakistanis | 82.2 /100 | #139 | Excellent 11.9% |
| Immigrants | Peru | 81.1 /100 | #140 | Excellent 11.9% |
| Immigrants | France | 80.5 /100 | #141 | Excellent 11.9% |
| Basques | 80.4 /100 | #142 | Excellent 11.9% |
| Brazilians | 79.7 /100 | #143 | Good 11.9% |
| Icelanders | 77.9 /100 | #144 | Good 11.9% |
| Syrians | 75.1 /100 | #145 | Good 12.0% |
| Afghans | 74.9 /100 | #146 | Good 12.0% |
| Immigrants | Bosnia and Herzegovina | 73.7 /100 | #147 | Good 12.0% |
| Immigrants | Germany | 72.7 /100 | #148 | Good 12.0% |