Immigrants from Panama vs Immigrants from Albania Seniors Poverty Over the Age of 65
COMPARE
Immigrants from Panama
Immigrants from Albania
Seniors Poverty Over the Age of 65
Seniors Poverty Over the Age of 65 Comparison
Immigrants from Panama
Immigrants from Albania
12.4%
SENIORS POVERTY OVER THE AGE OF 65
0.2/ 100
METRIC RATING
256th/ 347
METRIC RANK
12.1%
SENIORS POVERTY OVER THE AGE OF 65
0.9/ 100
METRIC RATING
241st/ 347
METRIC RANK
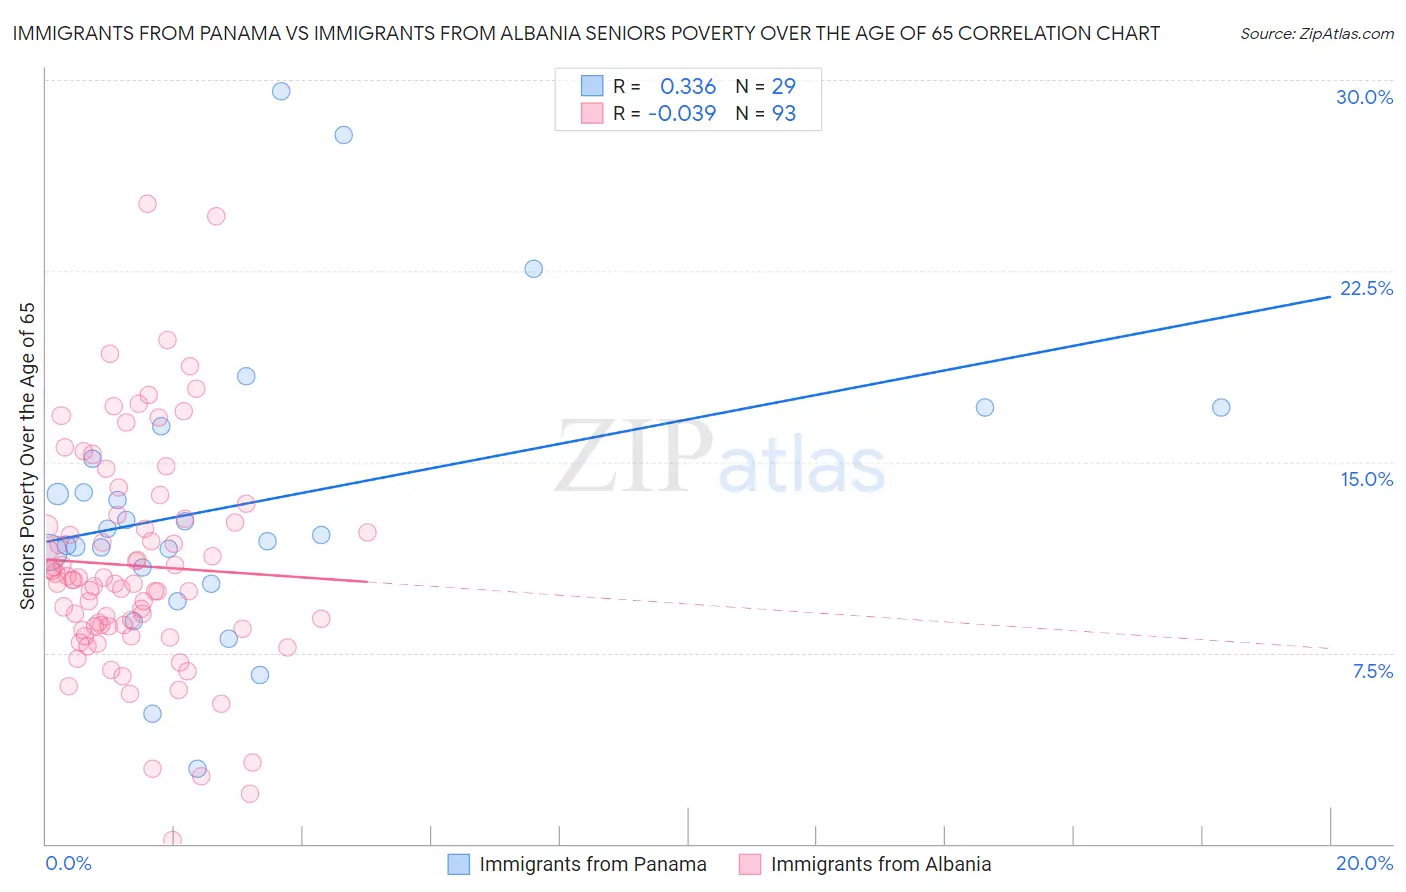
Immigrants from Panama vs Immigrants from Albania Seniors Poverty Over the Age of 65 Correlation Chart
The statistical analysis conducted on geographies consisting of 220,891,607 people shows a mild positive correlation between the proportion of Immigrants from Panama and poverty level among seniors over the age of 65 in the United States with a correlation coefficient (R) of 0.336 and weighted average of 12.4%. Similarly, the statistical analysis conducted on geographies consisting of 119,248,637 people shows no correlation between the proportion of Immigrants from Albania and poverty level among seniors over the age of 65 in the United States with a correlation coefficient (R) of -0.039 and weighted average of 12.1%, a difference of 2.8%.
Seniors Poverty Over the Age of 65 Correlation Summary
| Measurement | Immigrants from Panama | Immigrants from Albania |
| Minimum | 3.0% | 0.16% |
| Maximum | 29.6% | 25.1% |
| Range | 26.6% | 25.0% |
| Mean | 13.4% | 10.9% |
| Median | 12.1% | 10.4% |
| Interquartile 25% (IQ1) | 10.5% | 8.5% |
| Interquartile 75% (IQ3) | 15.8% | 12.7% |
| Interquartile Range (IQR) | 5.2% | 4.2% |
| Standard Deviation (Sample) | 5.8% | 4.4% |
| Standard Deviation (Population) | 5.7% | 4.3% |
Demographics Similar to Immigrants from Panama and Immigrants from Albania by Seniors Poverty Over the Age of 65
In terms of seniors poverty over the age of 65, the demographic groups most similar to Immigrants from Panama are Immigrants (12.4%, a difference of 0.010%), Mexican American Indian (12.4%, a difference of 0.23%), Dutch West Indian (12.4%, a difference of 0.25%), Immigrants from Cambodia (12.4%, a difference of 0.36%), and Shoshone (12.3%, a difference of 0.58%). Similarly, the demographic groups most similar to Immigrants from Albania are Comanche (12.1%, a difference of 0.020%), Subsaharan African (12.1%, a difference of 0.040%), Immigrants from Spain (12.1%, a difference of 0.12%), Uruguayan (12.1%, a difference of 0.16%), and Immigrants from Portugal (12.1%, a difference of 0.38%).
| Demographics | Rating | Rank | Seniors Poverty Over the Age of 65 |
| Seminole | 1.1 /100 | #238 | Tragic 12.0% |
| Immigrants | Spain | 1.0 /100 | #239 | Tragic 12.1% |
| Comanche | 0.9 /100 | #240 | Tragic 12.1% |
| Immigrants | Albania | 0.9 /100 | #241 | Tragic 12.1% |
| Sub-Saharan Africans | 0.9 /100 | #242 | Tragic 12.1% |
| Uruguayans | 0.8 /100 | #243 | Tragic 12.1% |
| Immigrants | Portugal | 0.8 /100 | #244 | Tragic 12.1% |
| Chippewa | 0.7 /100 | #245 | Tragic 12.1% |
| Cree | 0.7 /100 | #246 | Tragic 12.1% |
| Japanese | 0.6 /100 | #247 | Tragic 12.2% |
| Spanish Americans | 0.6 /100 | #248 | Tragic 12.2% |
| Ute | 0.6 /100 | #249 | Tragic 12.2% |
| Immigrants | Liberia | 0.5 /100 | #250 | Tragic 12.2% |
| Somalis | 0.3 /100 | #251 | Tragic 12.3% |
| Armenians | 0.3 /100 | #252 | Tragic 12.3% |
| Shoshone | 0.3 /100 | #253 | Tragic 12.3% |
| Immigrants | Cambodia | 0.3 /100 | #254 | Tragic 12.4% |
| Mexican American Indians | 0.3 /100 | #255 | Tragic 12.4% |
| Immigrants | Panama | 0.2 /100 | #256 | Tragic 12.4% |
| Immigrants | Immigrants | 0.2 /100 | #257 | Tragic 12.4% |
| Dutch West Indians | 0.2 /100 | #258 | Tragic 12.4% |