Immigrants from Pakistan vs Pakistani Family Poverty
COMPARE
Immigrants from Pakistan
Pakistani
Family Poverty
Family Poverty Comparison
Immigrants from Pakistan
Pakistanis
8.0%
FAMILY POVERTY
96.6/ 100
METRIC RATING
94th/ 347
METRIC RANK
8.3%
FAMILY POVERTY
90.8/ 100
METRIC RATING
125th/ 347
METRIC RANK
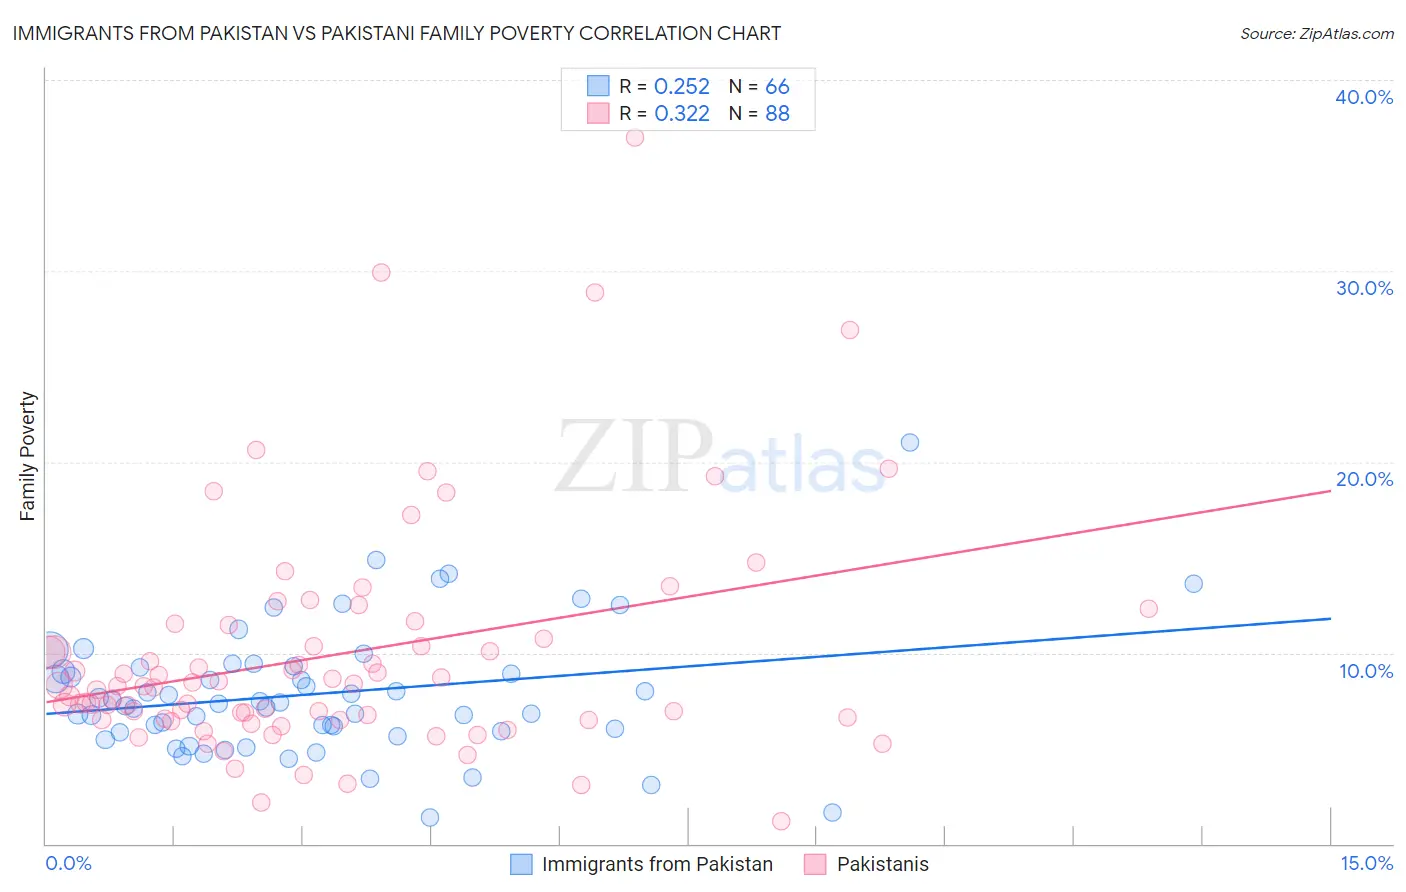
Immigrants from Pakistan vs Pakistani Family Poverty Correlation Chart
The statistical analysis conducted on geographies consisting of 283,475,243 people shows a weak positive correlation between the proportion of Immigrants from Pakistan and poverty level among families in the United States with a correlation coefficient (R) of 0.252 and weighted average of 8.0%. Similarly, the statistical analysis conducted on geographies consisting of 334,856,676 people shows a mild positive correlation between the proportion of Pakistanis and poverty level among families in the United States with a correlation coefficient (R) of 0.322 and weighted average of 8.3%, a difference of 3.8%.
Family Poverty Correlation Summary
| Measurement | Immigrants from Pakistan | Pakistani |
| Minimum | 1.4% | 1.2% |
| Maximum | 21.0% | 37.0% |
| Range | 19.6% | 35.8% |
| Mean | 7.8% | 9.9% |
| Median | 7.4% | 8.3% |
| Interquartile 25% (IQ1) | 5.9% | 6.5% |
| Interquartile 75% (IQ3) | 9.2% | 11.1% |
| Interquartile Range (IQR) | 3.3% | 4.6% |
| Standard Deviation (Sample) | 3.3% | 6.1% |
| Standard Deviation (Population) | 3.3% | 6.1% |
Similar Demographics by Family Poverty
Demographics Similar to Immigrants from Pakistan by Family Poverty
In terms of family poverty, the demographic groups most similar to Immigrants from Pakistan are Immigrants from Philippines (8.0%, a difference of 0.010%), Immigrants from Turkey (8.0%, a difference of 0.030%), Tlingit-Haida (8.0%, a difference of 0.11%), Czechoslovakian (8.0%, a difference of 0.29%), and Immigrants from Switzerland (8.1%, a difference of 0.44%).
| Demographics | Rating | Rank | Family Poverty |
| Belgians | 97.3 /100 | #87 | Exceptional 8.0% |
| Serbians | 97.2 /100 | #88 | Exceptional 8.0% |
| Immigrants | Denmark | 97.1 /100 | #89 | Exceptional 8.0% |
| Immigrants | England | 97.1 /100 | #90 | Exceptional 8.0% |
| Immigrants | Italy | 97.0 /100 | #91 | Exceptional 8.0% |
| Czechoslovakians | 96.8 /100 | #92 | Exceptional 8.0% |
| Tlingit-Haida | 96.7 /100 | #93 | Exceptional 8.0% |
| Immigrants | Pakistan | 96.6 /100 | #94 | Exceptional 8.0% |
| Immigrants | Philippines | 96.5 /100 | #95 | Exceptional 8.0% |
| Immigrants | Turkey | 96.5 /100 | #96 | Exceptional 8.0% |
| Immigrants | Switzerland | 96.1 /100 | #97 | Exceptional 8.1% |
| Immigrants | South Africa | 95.9 /100 | #98 | Exceptional 8.1% |
| Welsh | 95.8 /100 | #99 | Exceptional 8.1% |
| New Zealanders | 95.8 /100 | #100 | Exceptional 8.1% |
| Immigrants | Norway | 95.7 /100 | #101 | Exceptional 8.1% |
Demographics Similar to Pakistanis by Family Poverty
In terms of family poverty, the demographic groups most similar to Pakistanis are Soviet Union (8.3%, a difference of 0.040%), Palestinian (8.3%, a difference of 0.14%), Icelander (8.3%, a difference of 0.20%), Paraguayan (8.3%, a difference of 0.21%), and Native Hawaiian (8.3%, a difference of 0.22%).
| Demographics | Rating | Rank | Family Poverty |
| Immigrants | Western Europe | 92.9 /100 | #118 | Exceptional 8.2% |
| French | 92.8 /100 | #119 | Exceptional 8.3% |
| Immigrants | Egypt | 91.6 /100 | #120 | Exceptional 8.3% |
| Native Hawaiians | 91.3 /100 | #121 | Exceptional 8.3% |
| Paraguayans | 91.2 /100 | #122 | Exceptional 8.3% |
| Palestinians | 91.1 /100 | #123 | Exceptional 8.3% |
| Soviet Union | 90.8 /100 | #124 | Exceptional 8.3% |
| Pakistanis | 90.8 /100 | #125 | Exceptional 8.3% |
| Icelanders | 90.3 /100 | #126 | Exceptional 8.3% |
| Immigrants | Hungary | 89.9 /100 | #127 | Excellent 8.4% |
| Argentineans | 89.6 /100 | #128 | Excellent 8.4% |
| Portuguese | 89.2 /100 | #129 | Excellent 8.4% |
| Immigrants | Bosnia and Herzegovina | 88.6 /100 | #130 | Excellent 8.4% |
| Puget Sound Salish | 88.6 /100 | #131 | Excellent 8.4% |
| Immigrants | Argentina | 88.2 /100 | #132 | Excellent 8.4% |