Immigrants from Bolivia vs Pakistani Family Poverty
COMPARE
Immigrants from Bolivia
Pakistani
Family Poverty
Family Poverty Comparison
Immigrants from Bolivia
Pakistanis
7.7%
FAMILY POVERTY
98.9/ 100
METRIC RATING
49th/ 347
METRIC RANK
8.3%
FAMILY POVERTY
90.8/ 100
METRIC RATING
125th/ 347
METRIC RANK
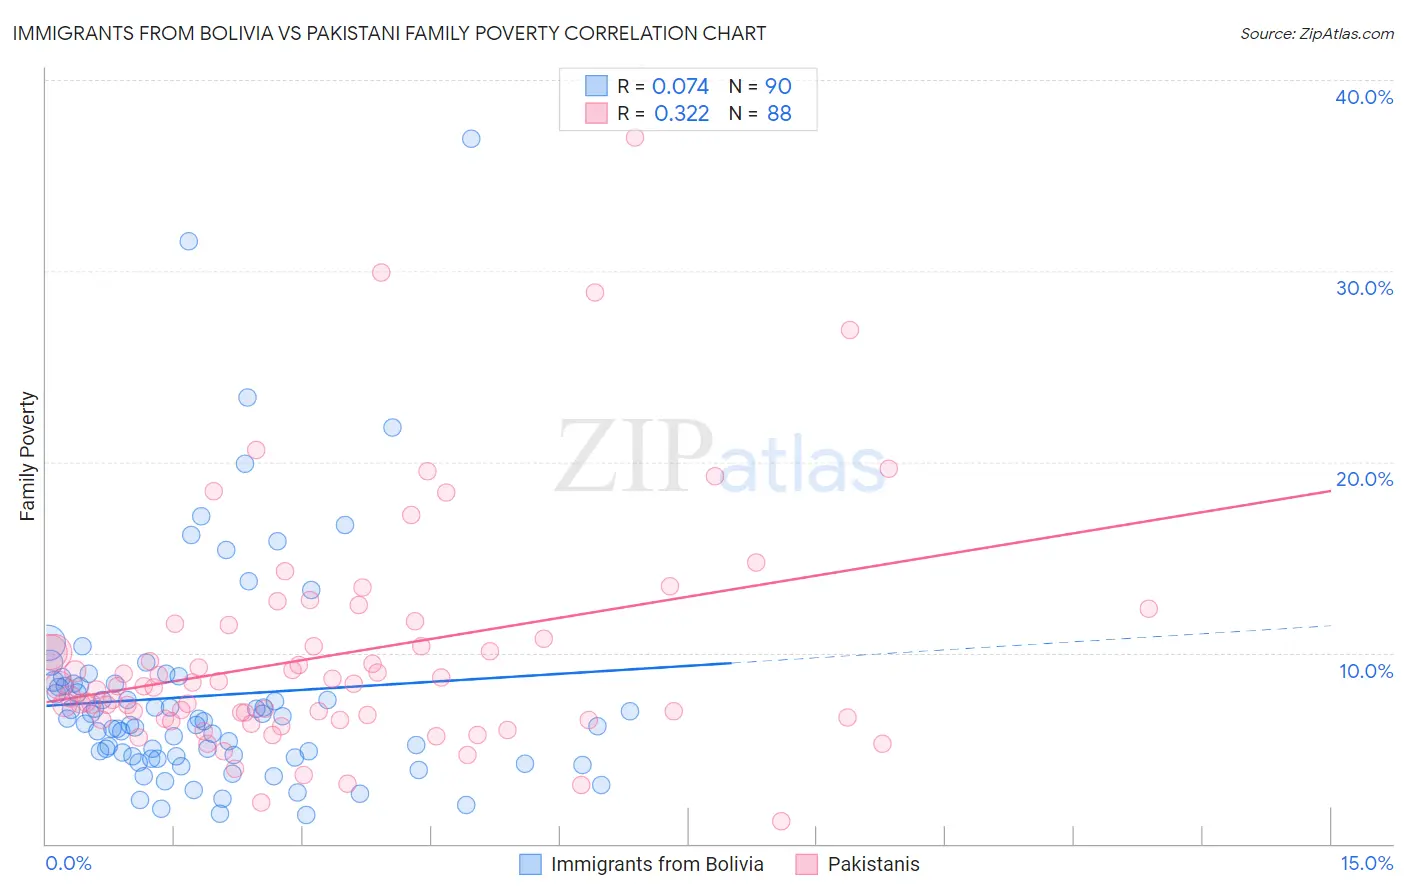
Immigrants from Bolivia vs Pakistani Family Poverty Correlation Chart
The statistical analysis conducted on geographies consisting of 158,596,723 people shows a slight positive correlation between the proportion of Immigrants from Bolivia and poverty level among families in the United States with a correlation coefficient (R) of 0.074 and weighted average of 7.7%. Similarly, the statistical analysis conducted on geographies consisting of 334,856,676 people shows a mild positive correlation between the proportion of Pakistanis and poverty level among families in the United States with a correlation coefficient (R) of 0.322 and weighted average of 8.3%, a difference of 8.4%.
Family Poverty Correlation Summary
| Measurement | Immigrants from Bolivia | Pakistani |
| Minimum | 1.5% | 1.2% |
| Maximum | 36.9% | 37.0% |
| Range | 35.4% | 35.8% |
| Mean | 7.8% | 9.9% |
| Median | 6.4% | 8.3% |
| Interquartile 25% (IQ1) | 4.6% | 6.5% |
| Interquartile 75% (IQ3) | 8.4% | 11.1% |
| Interquartile Range (IQR) | 3.8% | 4.6% |
| Standard Deviation (Sample) | 5.9% | 6.1% |
| Standard Deviation (Population) | 5.9% | 6.1% |
Similar Demographics by Family Poverty
Demographics Similar to Immigrants from Bolivia by Family Poverty
In terms of family poverty, the demographic groups most similar to Immigrants from Bolivia are Immigrants from North Macedonia (7.7%, a difference of 0.030%), Immigrants from Moldova (7.7%, a difference of 0.18%), Immigrants from Sri Lanka (7.7%, a difference of 0.19%), Immigrants from Czechoslovakia (7.7%, a difference of 0.20%), and Tongan (7.7%, a difference of 0.22%).
| Demographics | Rating | Rank | Family Poverty |
| Scandinavians | 99.1 /100 | #42 | Exceptional 7.6% |
| Immigrants | Austria | 99.1 /100 | #43 | Exceptional 7.6% |
| Germans | 99.0 /100 | #44 | Exceptional 7.7% |
| Okinawans | 98.9 /100 | #45 | Exceptional 7.7% |
| Tongans | 98.9 /100 | #46 | Exceptional 7.7% |
| Immigrants | Czechoslovakia | 98.9 /100 | #47 | Exceptional 7.7% |
| Immigrants | Sri Lanka | 98.9 /100 | #48 | Exceptional 7.7% |
| Immigrants | Bolivia | 98.9 /100 | #49 | Exceptional 7.7% |
| Immigrants | North Macedonia | 98.9 /100 | #50 | Exceptional 7.7% |
| Immigrants | Moldova | 98.8 /100 | #51 | Exceptional 7.7% |
| Indians (Asian) | 98.8 /100 | #52 | Exceptional 7.7% |
| Swiss | 98.8 /100 | #53 | Exceptional 7.7% |
| Immigrants | Sweden | 98.8 /100 | #54 | Exceptional 7.7% |
| Immigrants | Eastern Asia | 98.7 /100 | #55 | Exceptional 7.7% |
| Immigrants | Serbia | 98.7 /100 | #56 | Exceptional 7.7% |
Demographics Similar to Pakistanis by Family Poverty
In terms of family poverty, the demographic groups most similar to Pakistanis are Soviet Union (8.3%, a difference of 0.040%), Palestinian (8.3%, a difference of 0.14%), Icelander (8.3%, a difference of 0.20%), Paraguayan (8.3%, a difference of 0.21%), and Native Hawaiian (8.3%, a difference of 0.22%).
| Demographics | Rating | Rank | Family Poverty |
| Immigrants | Western Europe | 92.9 /100 | #118 | Exceptional 8.2% |
| French | 92.8 /100 | #119 | Exceptional 8.3% |
| Immigrants | Egypt | 91.6 /100 | #120 | Exceptional 8.3% |
| Native Hawaiians | 91.3 /100 | #121 | Exceptional 8.3% |
| Paraguayans | 91.2 /100 | #122 | Exceptional 8.3% |
| Palestinians | 91.1 /100 | #123 | Exceptional 8.3% |
| Soviet Union | 90.8 /100 | #124 | Exceptional 8.3% |
| Pakistanis | 90.8 /100 | #125 | Exceptional 8.3% |
| Icelanders | 90.3 /100 | #126 | Exceptional 8.3% |
| Immigrants | Hungary | 89.9 /100 | #127 | Excellent 8.4% |
| Argentineans | 89.6 /100 | #128 | Excellent 8.4% |
| Portuguese | 89.2 /100 | #129 | Excellent 8.4% |
| Immigrants | Bosnia and Herzegovina | 88.6 /100 | #130 | Excellent 8.4% |
| Puget Sound Salish | 88.6 /100 | #131 | Excellent 8.4% |
| Immigrants | Argentina | 88.2 /100 | #132 | Excellent 8.4% |