Thai vs Pakistani Family Poverty

COMPARE

Thai
Race
Ancestry
AfghanAfricanAlaska NativeAlaskan AthabascanAlbanianAleutAlsatianAmericanApacheArabArapahoArgentineanArmenianAssyrian/Chaldean/SyriacAustralianAustrianBahamianBangladeshiBarbadianBasqueBelgianBelizeanBermudanBhutaneseBlackfeetBolivianBrazilianBritishBritish West IndianBulgarianBurmeseCajunCambodianCanadianCape VerdeanCarpatho RusynCelticCentral AmericanCentral American IndianCherokeeCheyenneChickasawChileanChineseChippewaChoctawColombianColvilleComancheCosta RicanCreeCreekCroatianCrowCubanCypriotCzechCzechoslovakianDanishDelawareDominicanDutchDutch West IndianEastern EuropeanEcuadorianEgyptianEnglishEstonianEthiopianEuropeanFijianFilipinoFinnishFrenchFrench American IndianFrench CanadianGermanGerman RussianGhanaianGreekGuamanian/ChamorroGuatemalanGuyaneseHaitianHmongHonduranHopiHoumaHungarianIcelanderIndian (Asian)IndonesianInupiatIranianIraqiIrishIroquoisIsraeliItalianJamaicanJapaneseJordanianKenyanKiowaKoreanLaotianLatvianLebaneseLiberianLithuanianLumbeeLuxembourgerMacedonianMalaysianMalteseMarshalleseMenomineeMexicanMexican American IndianMongolianMoroccanNative HawaiianNavajoNepaleseNew ZealanderNicaraguanNigerianNorthern EuropeanNorwegianOkinawanOsageOttawaPaiutePalestinianPanamanianParaguayanPennsylvania GermanPeruvianPimaPolishPortuguesePotawatomiPuebloPuerto RicanPuget Sound SalishRomanianRussianSalvadoranSamoanScandinavianScotch-IrishScottishSeminoleSenegaleseSerbianShoshoneSierra LeoneanSiouxSlavicSlovakSloveneSomaliSouth AfricanSouth AmericanSouth American IndianSoviet UnionSpaniardSpanishSpanish AmericanSpanish American IndianSri LankanSubsaharan AfricanSudaneseSwedishSwissSyrianTaiwaneseThaiTlingit-HaidaTohono O'OdhamTonganTrinidadian and TobagonianTsimshianTurkishU.S. Virgin IslanderUgandanUkrainianUruguayanUteVenezuelanVietnameseWelshWest IndianYakamaYaquiYugoslavianYumanYup'ikZimbabwean
Immigration
NonimmigrantsImmigrantsAfghanistanAfricaAlbaniaArgentinaArmeniaAsiaAustraliaAustriaBahamasBangladeshBarbadosBelarusBelgiumBelizeBoliviaBosnia and HerzegovinaBrazilBulgariaBurma/MyanmarCabo VerdeCambodiaCameroonCanadaCaribbeanCentral AmericaChileChinaColombiaCongoCosta RicaCroatiaCubaCzechoslovakiaDenmarkDominicaDominican RepublicEastern AfricaEastern AsiaEastern EuropeEcuadorEgyptEl SalvadorEnglandEritreaEthiopiaEuropeFijiFranceGermanyGhanaGreeceGrenadaGuatemalaGuyanaHaitiHondurasHong KongHungaryIndiaIndonesiaIranIraqIrelandIsraelItalyJamaicaJapanJordanKazakhstanKenyaKoreaKuwaitLaosLatin AmericaLatviaLebanonLiberiaLithuaniaMalaysiaMexicoMicronesiaMiddle AfricaMoldovaMoroccoNepalNetherlandsNicaraguaNigeriaNorth AmericaNorth MacedoniaNorthern AfricaNorthern EuropeNorwayOceaniaPakistanPanamaPeruPhilippinesPolandPortugalRomaniaRussiaSaudi ArabiaScotlandSenegalSerbiaSierra LeoneSingaporeSomaliaSouth AfricaSouth AmericaSouth Central AsiaSouth Eastern AsiaSouthern EuropeSpainSri LankaSt. Vincent and the GrenadinesSudanSwedenSwitzerlandSyriaTaiwanThailandTrinidad and TobagoTurkeyUgandaUkraineUruguayUzbekistanVenezuelaVietnamWest IndiesWestern AfricaWestern AsiaWestern EuropeYemenZaireZimbabweAzores
Pakistani
Race
Ancestry
AfghanAfricanAlaska NativeAlaskan AthabascanAlbanianAleutAlsatianAmericanApacheArabArapahoArgentineanArmenianAssyrian/Chaldean/SyriacAustralianAustrianBahamianBangladeshiBarbadianBasqueBelgianBelizeanBermudanBhutaneseBlackfeetBolivianBrazilianBritishBritish West IndianBulgarianBurmeseCajunCambodianCanadianCape VerdeanCarpatho RusynCelticCentral AmericanCentral American IndianCherokeeCheyenneChickasawChileanChineseChippewaChoctawColombianColvilleComancheCosta RicanCreeCreekCroatianCrowCubanCypriotCzechCzechoslovakianDanishDelawareDominicanDutchDutch West IndianEastern EuropeanEcuadorianEgyptianEnglishEstonianEthiopianEuropeanFijianFilipinoFinnishFrenchFrench American IndianFrench CanadianGermanGerman RussianGhanaianGreekGuamanian/ChamorroGuatemalanGuyaneseHaitianHmongHonduranHopiHoumaHungarianIcelanderIndian (Asian)IndonesianInupiatIranianIraqiIrishIroquoisIsraeliItalianJamaicanJapaneseJordanianKenyanKiowaKoreanLaotianLatvianLebaneseLiberianLithuanianLumbeeLuxembourgerMacedonianMalaysianMalteseMarshalleseMenomineeMexicanMexican American IndianMongolianMoroccanNative HawaiianNavajoNepaleseNew ZealanderNicaraguanNigerianNorthern EuropeanNorwegianOkinawanOsageOttawaPaiutePakistaniPalestinianPanamanianParaguayanPennsylvania GermanPeruvianPimaPolishPortuguesePotawatomiPuebloPuerto RicanPuget Sound SalishRomanianRussianSalvadoranSamoanScandinavianScotch-IrishScottishSeminoleSenegaleseSerbianShoshoneSierra LeoneanSiouxSlavicSlovakSloveneSomaliSouth AfricanSouth AmericanSouth American IndianSoviet UnionSpaniardSpanishSpanish AmericanSpanish American IndianSri LankanSubsaharan AfricanSudaneseSwedishSwissSyrianTaiwaneseTlingit-HaidaTohono O'OdhamTonganTrinidadian and TobagonianTsimshianTurkishU.S. Virgin IslanderUgandanUkrainianUruguayanUteVenezuelanVietnameseWelshWest IndianYakamaYaquiYugoslavianYumanYup'ikZimbabwean
Immigration
NonimmigrantsImmigrantsAfghanistanAfricaAlbaniaArgentinaArmeniaAsiaAustraliaAustriaBahamasBangladeshBarbadosBelarusBelgiumBelizeBoliviaBosnia and HerzegovinaBrazilBulgariaBurma/MyanmarCabo VerdeCambodiaCameroonCanadaCaribbeanCentral AmericaChileChinaColombiaCongoCosta RicaCroatiaCubaCzechoslovakiaDenmarkDominicaDominican RepublicEastern AfricaEastern AsiaEastern EuropeEcuadorEgyptEl SalvadorEnglandEritreaEthiopiaEuropeFijiFranceGermanyGhanaGreeceGrenadaGuatemalaGuyanaHaitiHondurasHong KongHungaryIndiaIndonesiaIranIraqIrelandIsraelItalyJamaicaJapanJordanKazakhstanKenyaKoreaKuwaitLaosLatin AmericaLatviaLebanonLiberiaLithuaniaMalaysiaMexicoMicronesiaMiddle AfricaMoldovaMoroccoNepalNetherlandsNicaraguaNigeriaNorth AmericaNorth MacedoniaNorthern AfricaNorthern EuropeNorwayOceaniaPakistanPanamaPeruPhilippinesPolandPortugalRomaniaRussiaSaudi ArabiaScotlandSenegalSerbiaSierra LeoneSingaporeSomaliaSouth AfricaSouth AmericaSouth Central AsiaSouth Eastern AsiaSouthern EuropeSpainSri LankaSt. Vincent and the GrenadinesSudanSwedenSwitzerlandSyriaTaiwanThailandTrinidad and TobagoTurkeyUgandaUkraineUruguayUzbekistanVenezuelaVietnamWest IndiesWestern AfricaWestern AsiaWestern EuropeYemenZaireZimbabweAzores
Family Poverty
Income
Poverty
Unemployment
Labor Participation
Family Structure
Vehicle Availability
Education Level
Disability

Family Poverty Comparison

Thais

Pakistanis

Exceptional
Exceptional
6.7%
FAMILY POVERTY
100.0/ 100
METRIC RATING
5th/ 347
METRIC RANK
8.3%
FAMILY POVERTY
90.8/ 100
METRIC RATING
125th/ 347
METRIC RANK

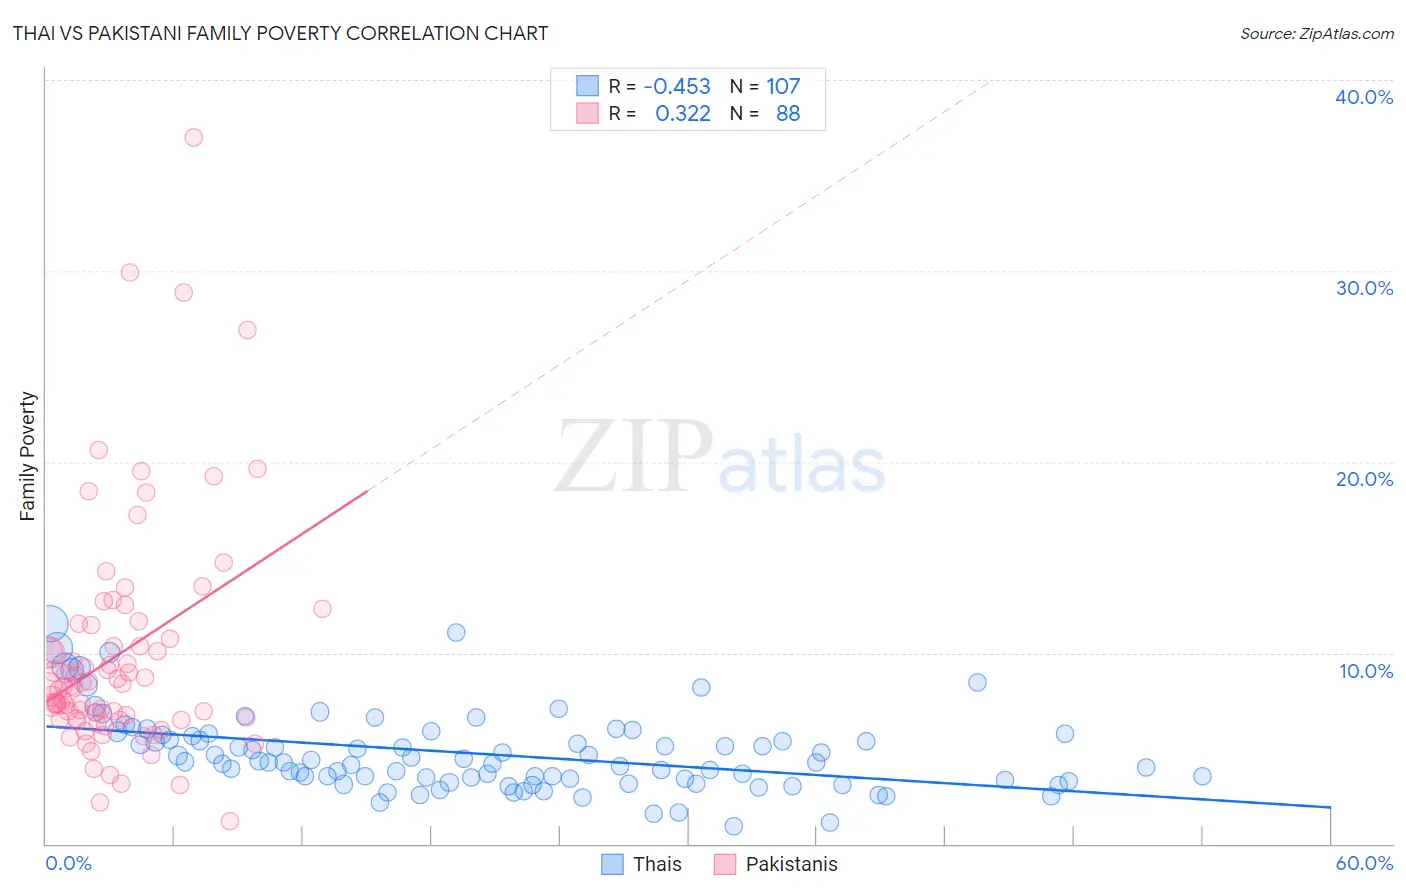
Thai vs Pakistani Family Poverty Correlation Chart

The statistical analysis conducted on geographies consisting of 473,767,426 people shows a moderate negative correlation between the proportion of Thais and poverty level among families in the United States with a correlation coefficient (R) of -0.453 and weighted average of 6.7%. Similarly, the statistical analysis conducted on geographies consisting of 334,856,676 people shows a mild positive correlation between the proportion of Pakistanis and poverty level among families in the United States with a correlation coefficient (R) of 0.322 and weighted average of 8.3%, a difference of 24.6%.
Thai vs Pakistani Family Poverty

Family Poverty Correlation Summary

MeasurementThaiPakistani
Minimum0.91%1.2%
Maximum11.5%37.0%
Range10.6%35.8%
Mean4.7%9.9%
Median4.3%8.3%
Interquartile 25% (IQ1)3.3%6.5%
Interquartile 75% (IQ3)5.7%11.1%
Interquartile Range (IQR)2.4%4.6%
Standard Deviation (Sample)2.1%6.1%
Standard Deviation (Population)2.1%6.1%

Similar Demographics by Family Poverty

Demographics Similar to Thais by Family Poverty

In terms of family poverty, the demographic groups most similar to Thais are Filipino (6.6%, a difference of 0.57%), Immigrants from Taiwan (6.6%, a difference of 1.2%), Chinese (6.5%, a difference of 2.8%), Norwegian (6.9%, a difference of 3.0%), and Immigrants from Ireland (7.0%, a difference of 4.4%).
DemographicsRating | RankFamily Poverty
Immigrants | India
100.0
/100
|
#1
Exceptional
6.2%
Chinese
100.0
/100
|
#2
Exceptional
6.5%
Immigrants | Taiwan
100.0
/100
|
#3
Exceptional
6.6%
Filipinos
100.0
/100
|
#4
Exceptional
6.6%
Thais
100.0
/100
|
#5
Exceptional
6.7%
Norwegians
99.9
/100
|
#6
Exceptional
6.9%
Immigrants | Ireland
99.9
/100
|
#7
Exceptional
7.0%
Bhutanese
99.9
/100
|
#8
Exceptional
7.0%
Latvians
99.9
/100
|
#9
Exceptional
7.1%
Bulgarians
99.8
/100
|
#10
Exceptional
7.1%
Immigrants | Singapore
99.8
/100
|
#11
Exceptional
7.1%
Maltese
99.8
/100
|
#12
Exceptional
7.1%
Swedes
99.8
/100
|
#13
Exceptional
7.1%
Iranians
99.8
/100
|
#14
Exceptional
7.1%
Lithuanians
99.8
/100
|
#15
Exceptional
7.2%

Demographics Similar to Pakistanis by Family Poverty

In terms of family poverty, the demographic groups most similar to Pakistanis are Soviet Union (8.3%, a difference of 0.040%), Palestinian (8.3%, a difference of 0.14%), Icelander (8.3%, a difference of 0.20%), Paraguayan (8.3%, a difference of 0.21%), and Native Hawaiian (8.3%, a difference of 0.22%).
DemographicsRating | RankFamily Poverty
Immigrants | Western Europe
92.9
/100
|
#118
Exceptional
8.2%
French
92.8
/100
|
#119
Exceptional
8.3%
Immigrants | Egypt
91.6
/100
|
#120
Exceptional
8.3%
Native Hawaiians
91.3
/100
|
#121
Exceptional
8.3%
Paraguayans
91.2
/100
|
#122
Exceptional
8.3%
Palestinians
91.1
/100
|
#123
Exceptional
8.3%
Soviet Union
90.8
/100
|
#124
Exceptional
8.3%
Pakistanis
90.8
/100
|
#125
Exceptional
8.3%
Icelanders
90.3
/100
|
#126
Exceptional
8.3%
Immigrants | Hungary
89.9
/100
|
#127
Excellent
8.4%
Argentineans
89.6
/100
|
#128
Excellent
8.4%
Portuguese
89.2
/100
|
#129
Excellent
8.4%
Immigrants | Bosnia and Herzegovina
88.6
/100
|
#130
Excellent
8.4%
Puget Sound Salish
88.6
/100
|
#131
Excellent
8.4%
Immigrants | Argentina
88.2
/100
|
#132
Excellent
8.4%